 README
README
devtermdash
Why this
When delvelop some service, you may expose some prometheus metrics,like request qps or response latency. But if you want to check the performance with the metrics, you need let the prometheus collect you service metrics, that may include many works, like compile and deploy service to env, and find some way to let prometheus collect you service metrics, like by podMonitor/serviceMonitor
Why the graph not as expect?
Because in reality, the prometheus will continually scrape and store the target metrics, but when use this tool, you may not continually run it to collect the target metrics, this will cause the metrics lost in some time range.
So you can use --reset to clean the history metircs, that you can see the expect graph.
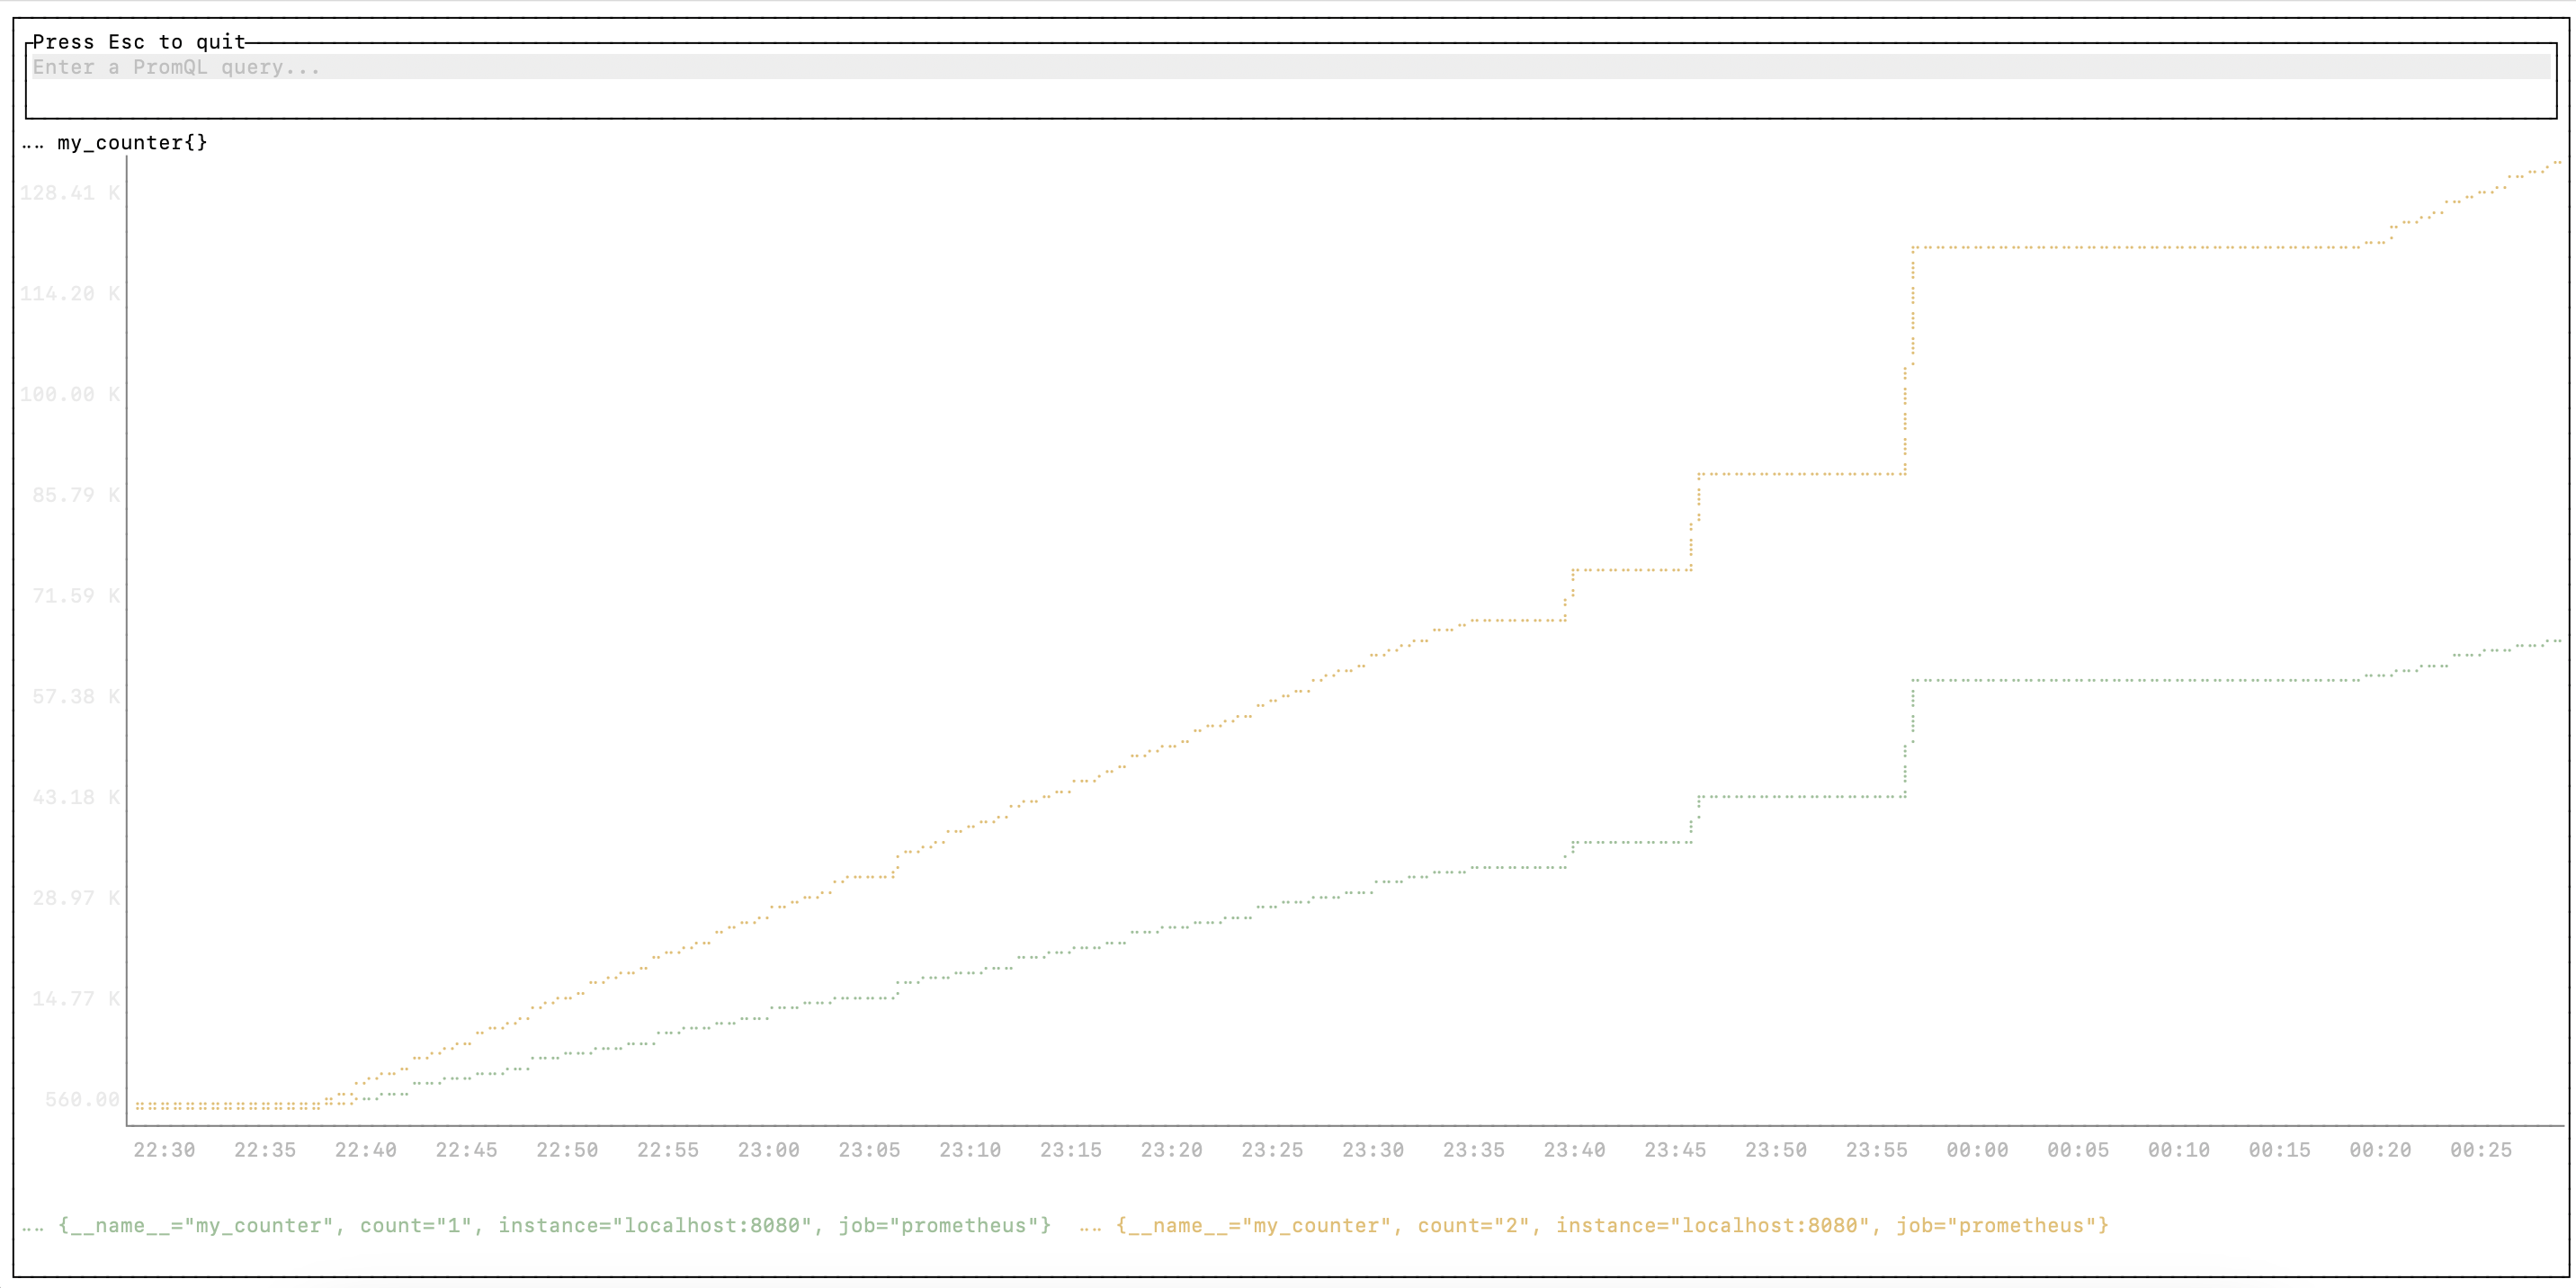
Terminal example
Limit
As it is for the serice in develop stage, now it just support showing one promQL, the max time range is 2h.
Build
$ go build
Usage
$ ./devtermdash --storage.tsdb.path=<storage_folder> --exporter.address=<target>
storage_folder: Folder for storagetarget: The scrape target, e.g.localhost:8080
 Documentation
Documentation

There is no documentation for this package.