 README
README
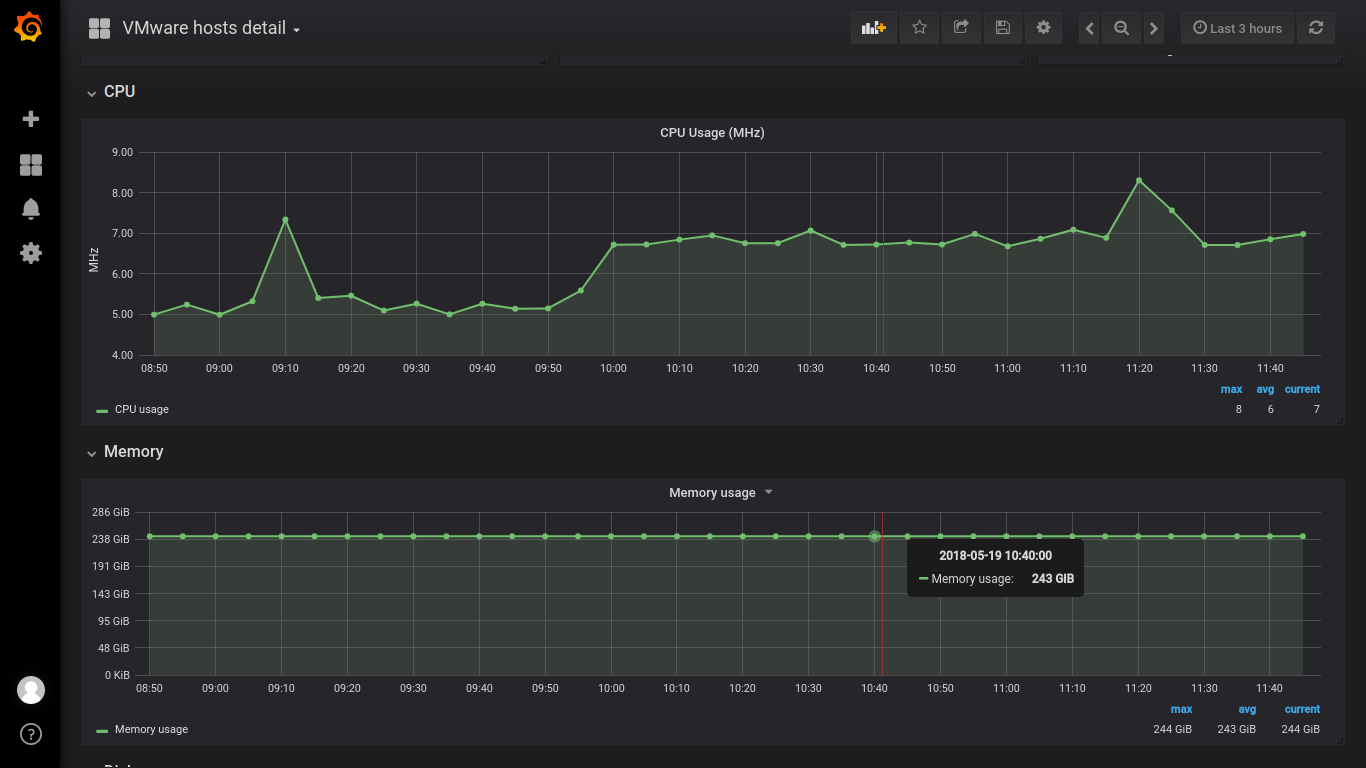
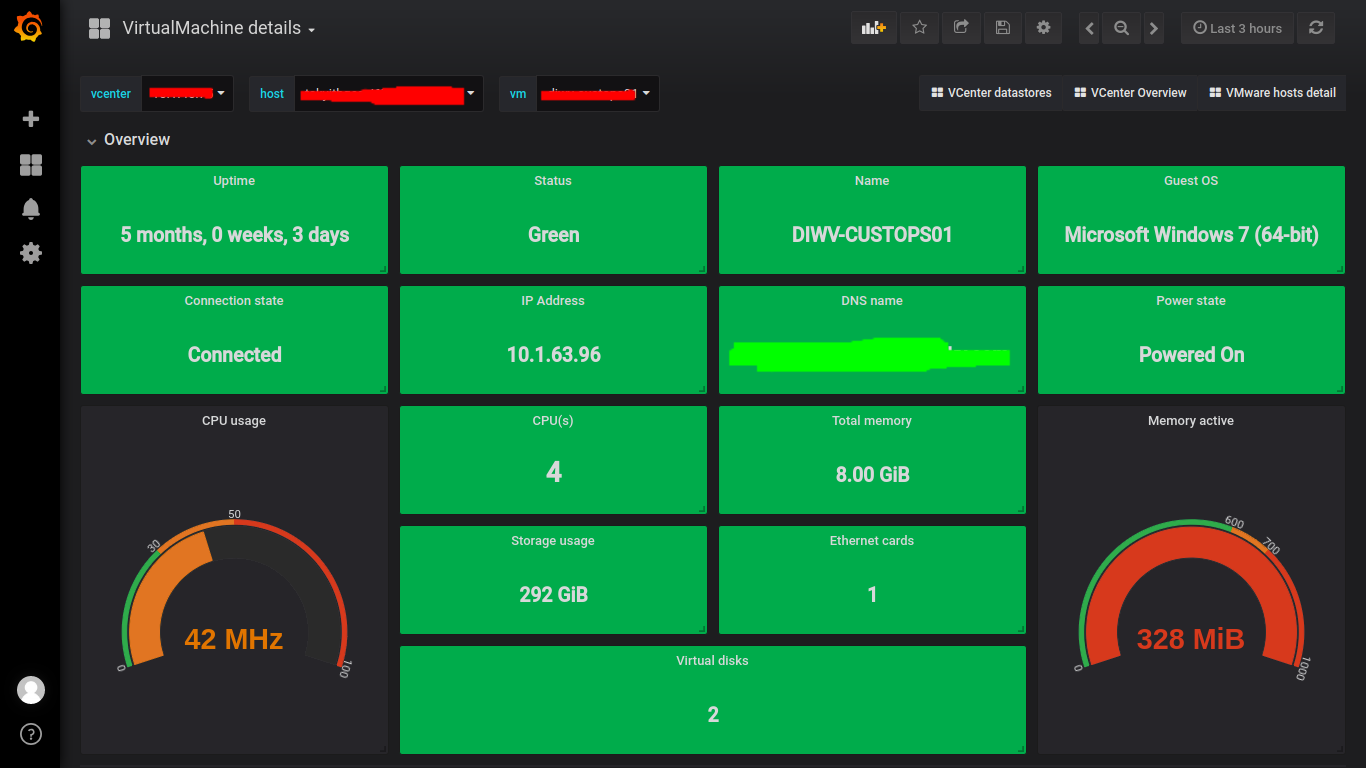
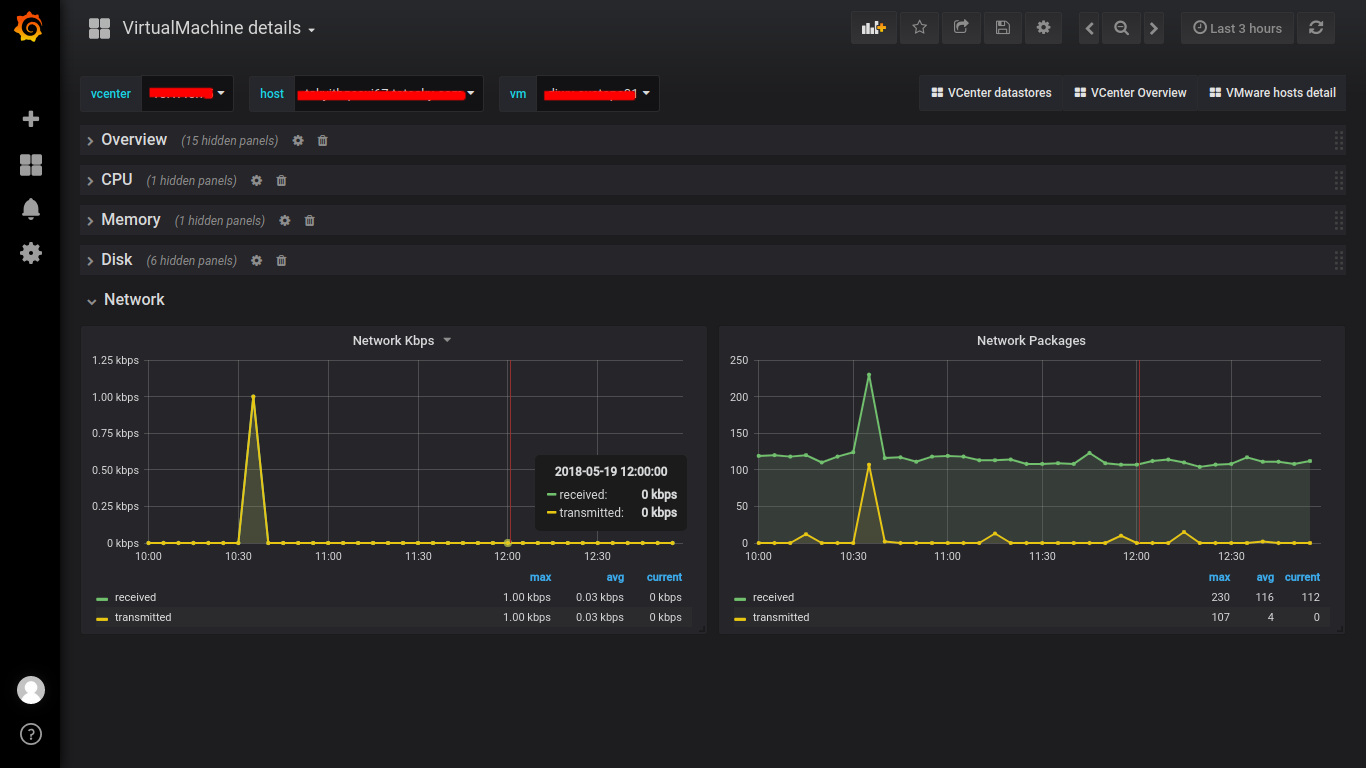
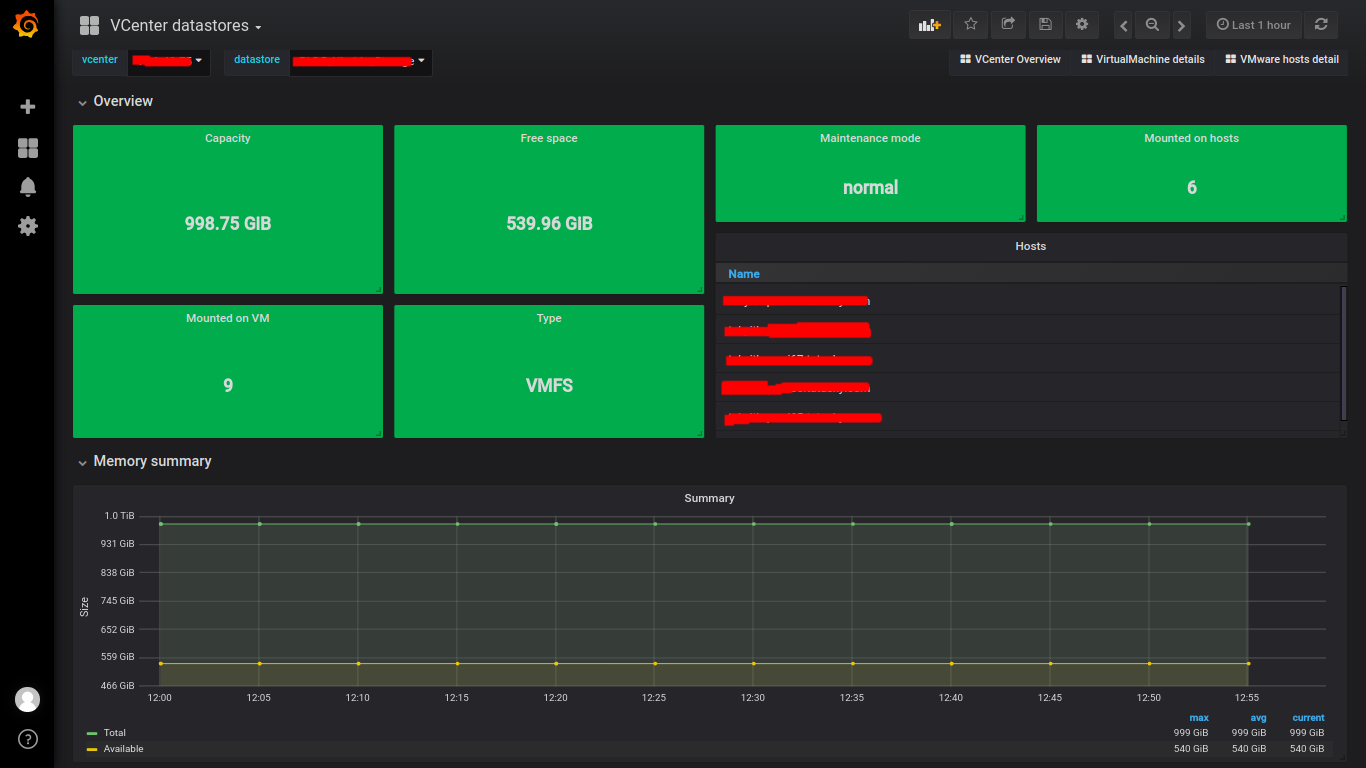
Collect VMware vCenter and ESXi performance metrics and send them to InfluxDB
Screenshots of Grafana dashboards
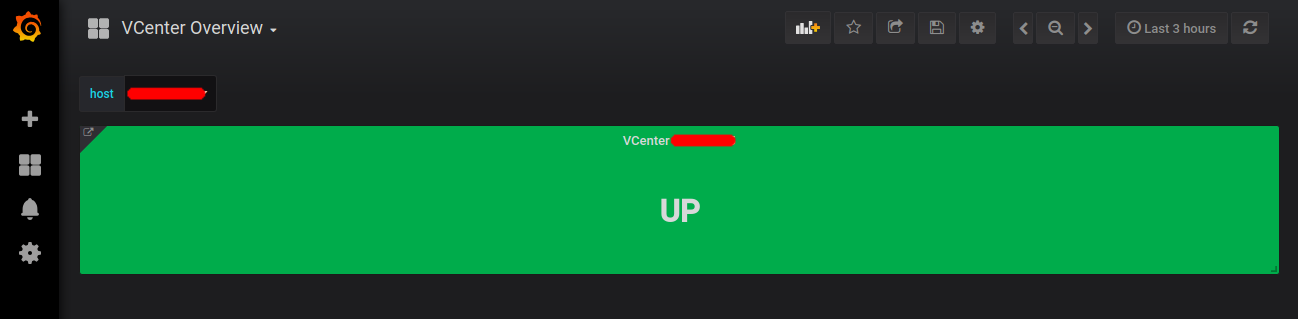
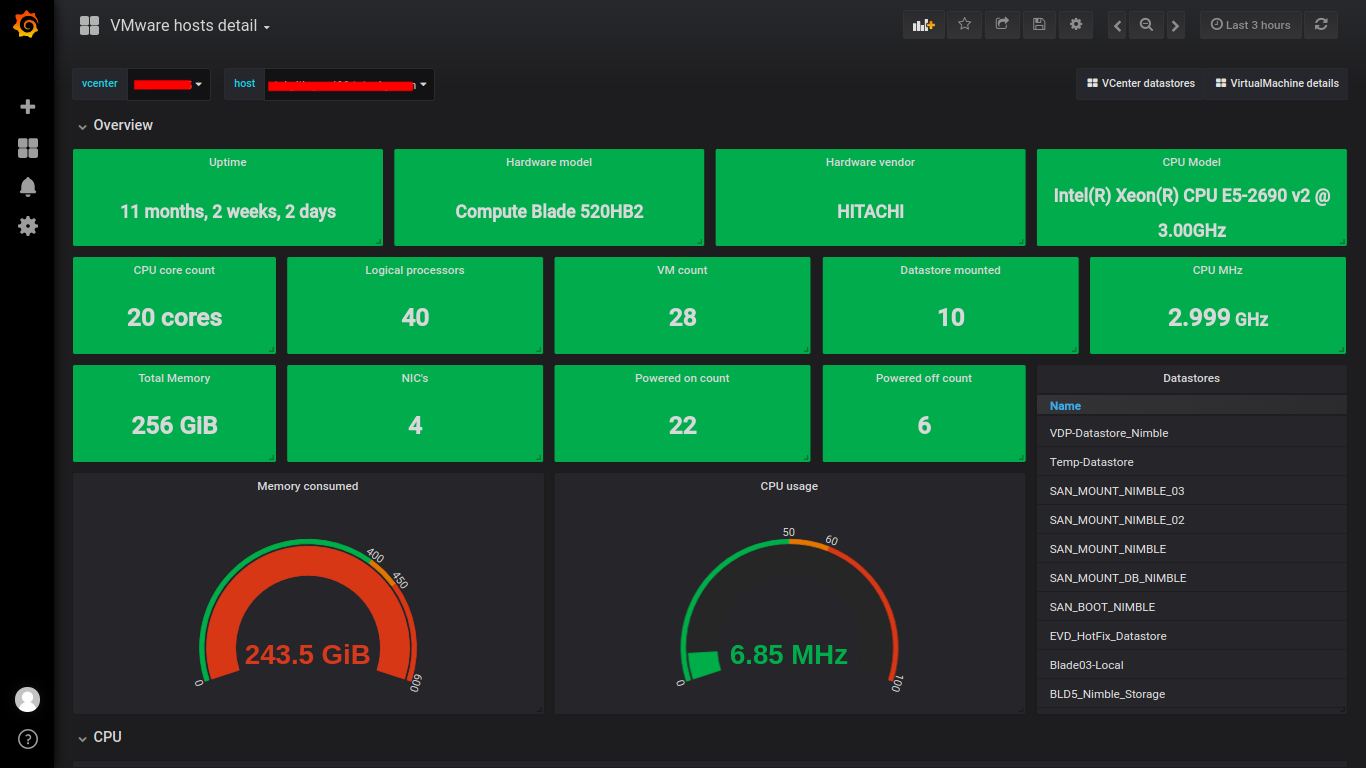
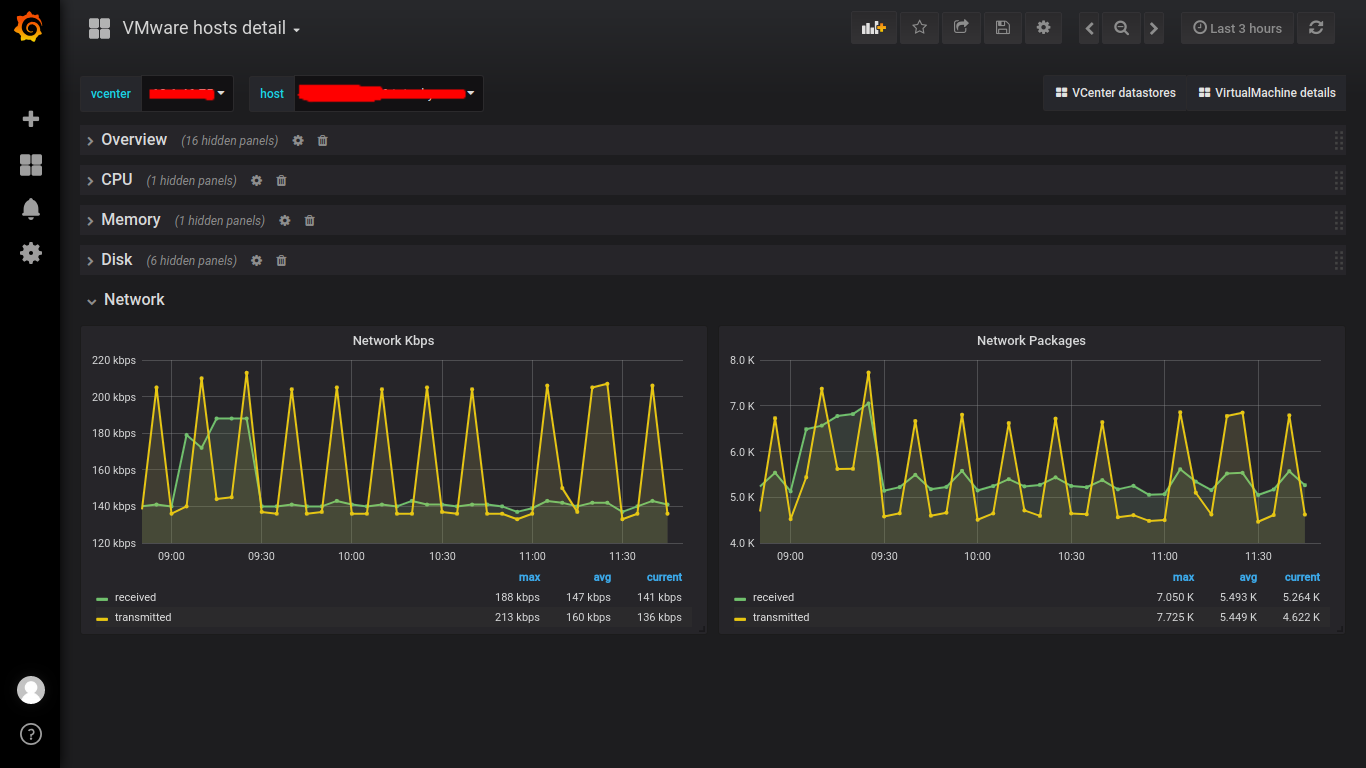
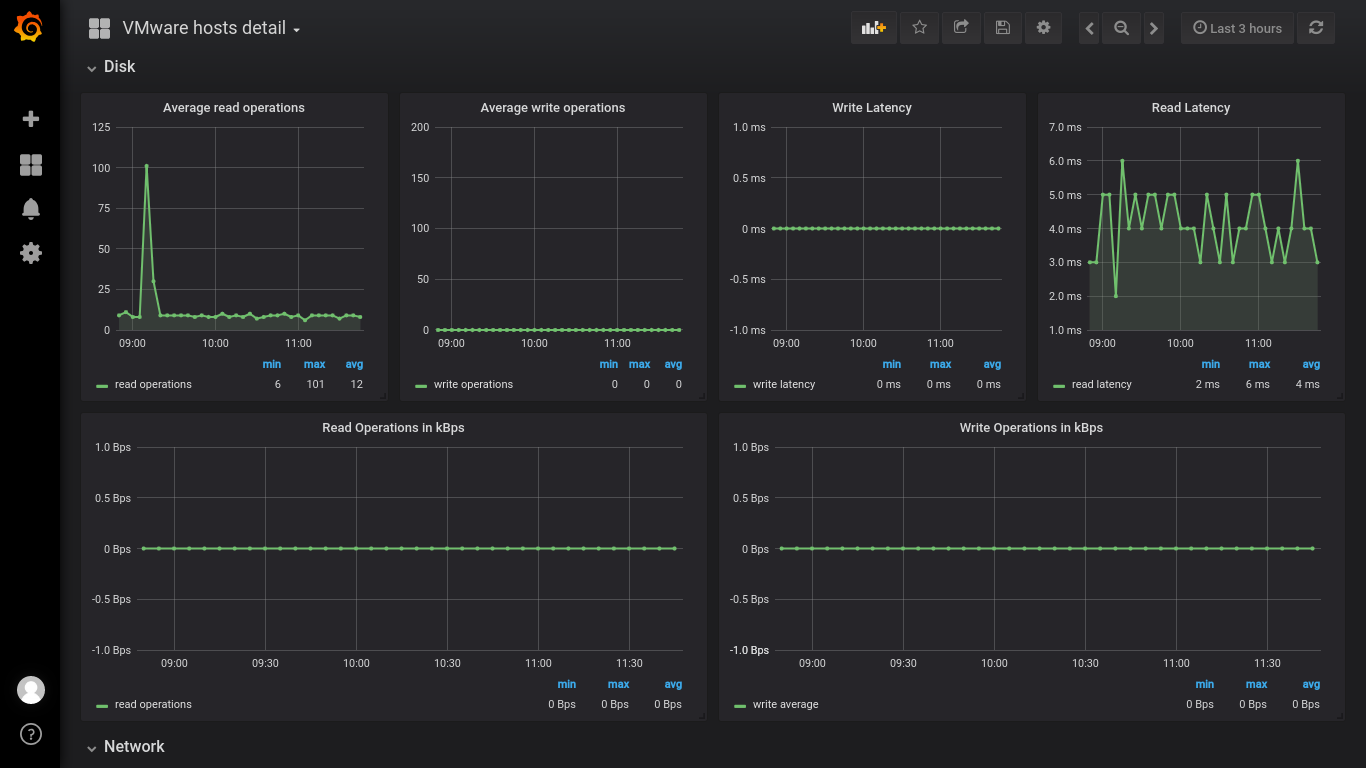
Description and Features
This is a tool written in Go that helps you do your own custom tailored monitoring, capacity planning and performance debugging of VMware based infrastructures. It collects all possible metrics from vCenters and ESXi hypervisors about hosts, clusters, resource pools, datastores and virtual machines and sends them to an InfluxDB database (a popular open source time series database project written in Go), which you can then visualise in Grafana (links to sample dashboards below) or Chronograf, and use Grafana, Kapacitor or custom scripts to do alerting based on your needs, KPIs, capacity plannings/expectations.
 Documentation
Documentation

There is no documentation for this package.
Click to show internal directories.
Click to hide internal directories.