cryptarch


Cryptarch is a tool that can be used to extract information with a CLI and observe it over time. It
is meant to aid system administrators, platform engineers, or anyone who spends time doing
operations in a command line.
- It's like a better
watch that can draw graphs, tables, etc.
- It's like a simplified Prometheus that can run directly in your console.
- It can act as a bridge between a command line and external monitoring systems.
This project is in an active, "alpha" development phase, but should generally be useable.
Setup
You can also just:
go install github.com/spacez320/cryptarch/cmd/cryptarch@latest
Usage
Cryptarch expects a query to gather data with (e.g. a CLI command, a process ID, etc.). Queries
produce results that are parsed automatically and stored as a time series.
Note: I'm not good at making gifs, so some of the commands shown may be outdated, even if the
functionality isn't.
Modes
Cryptarch has "modes" that determine what type of query should be provided.
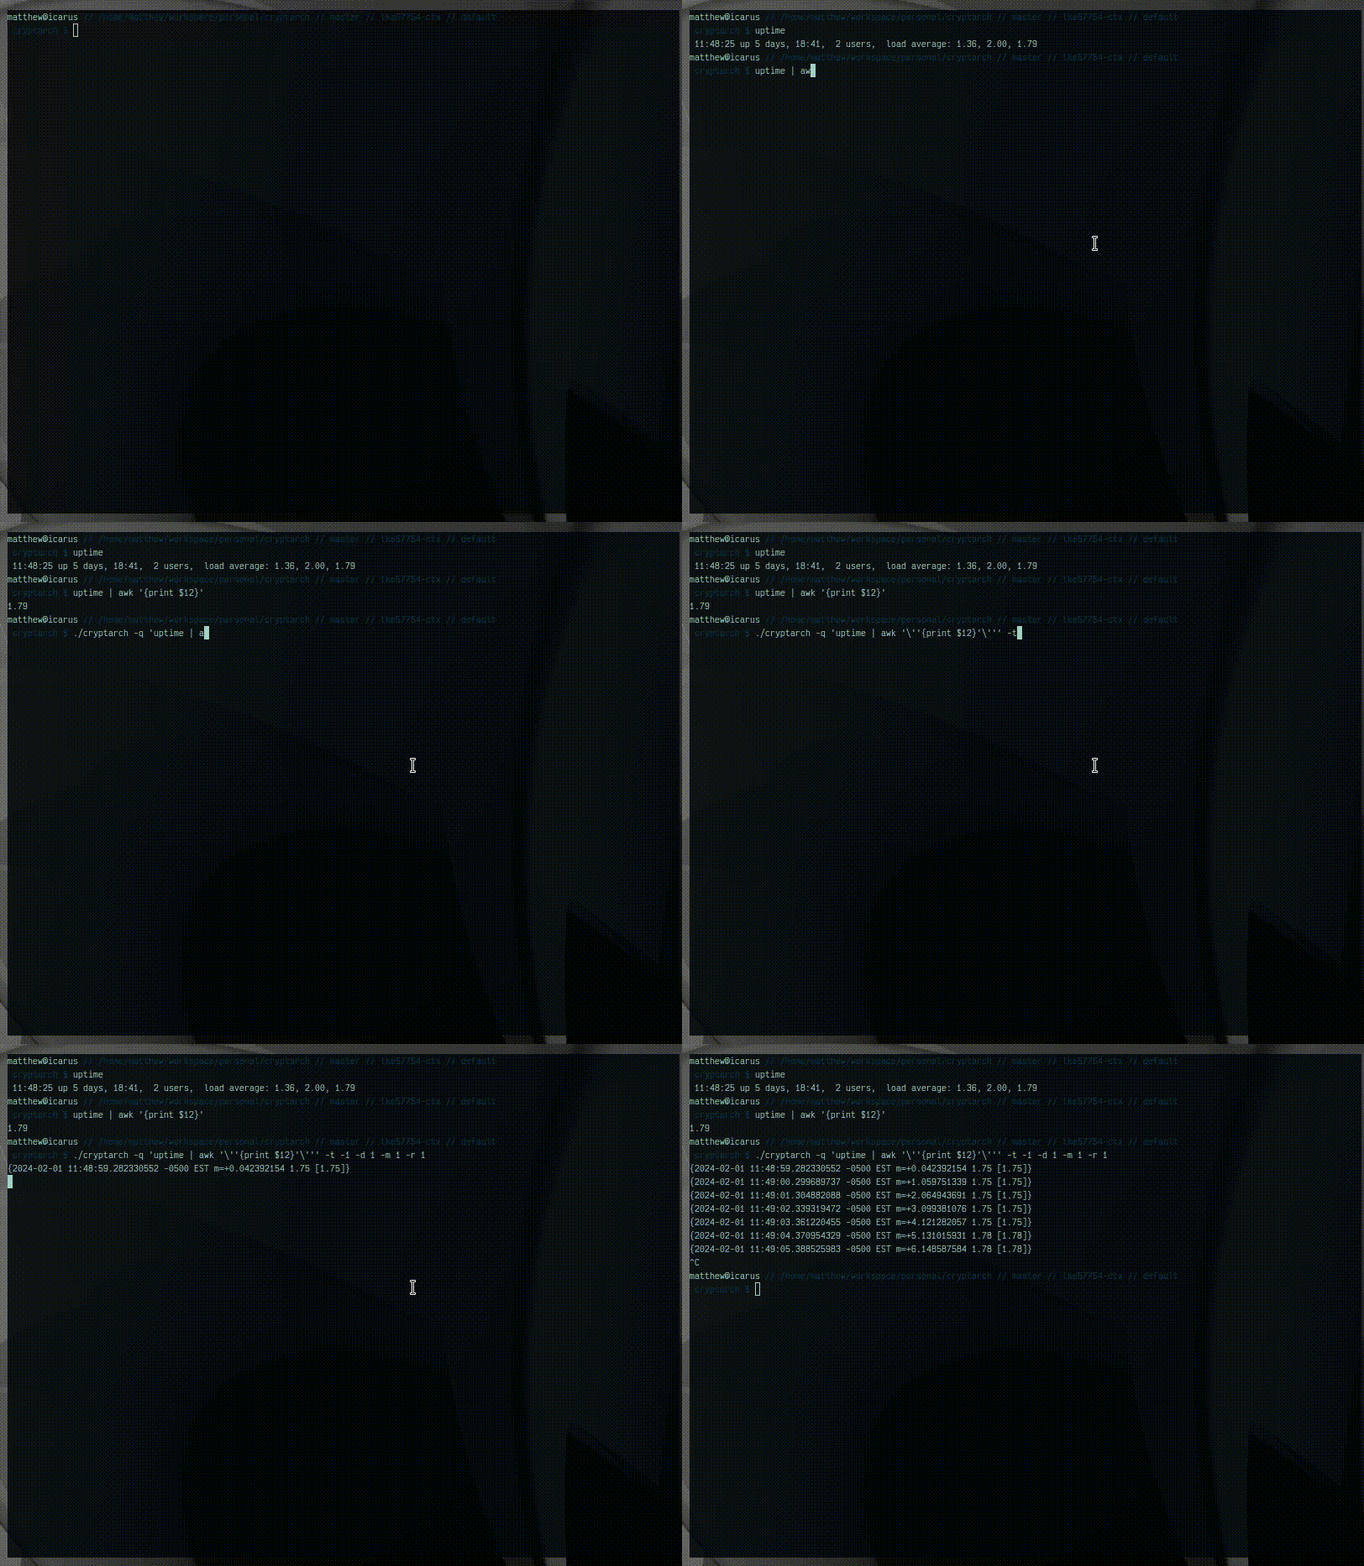
Query mode is the default and is for running shell commands.

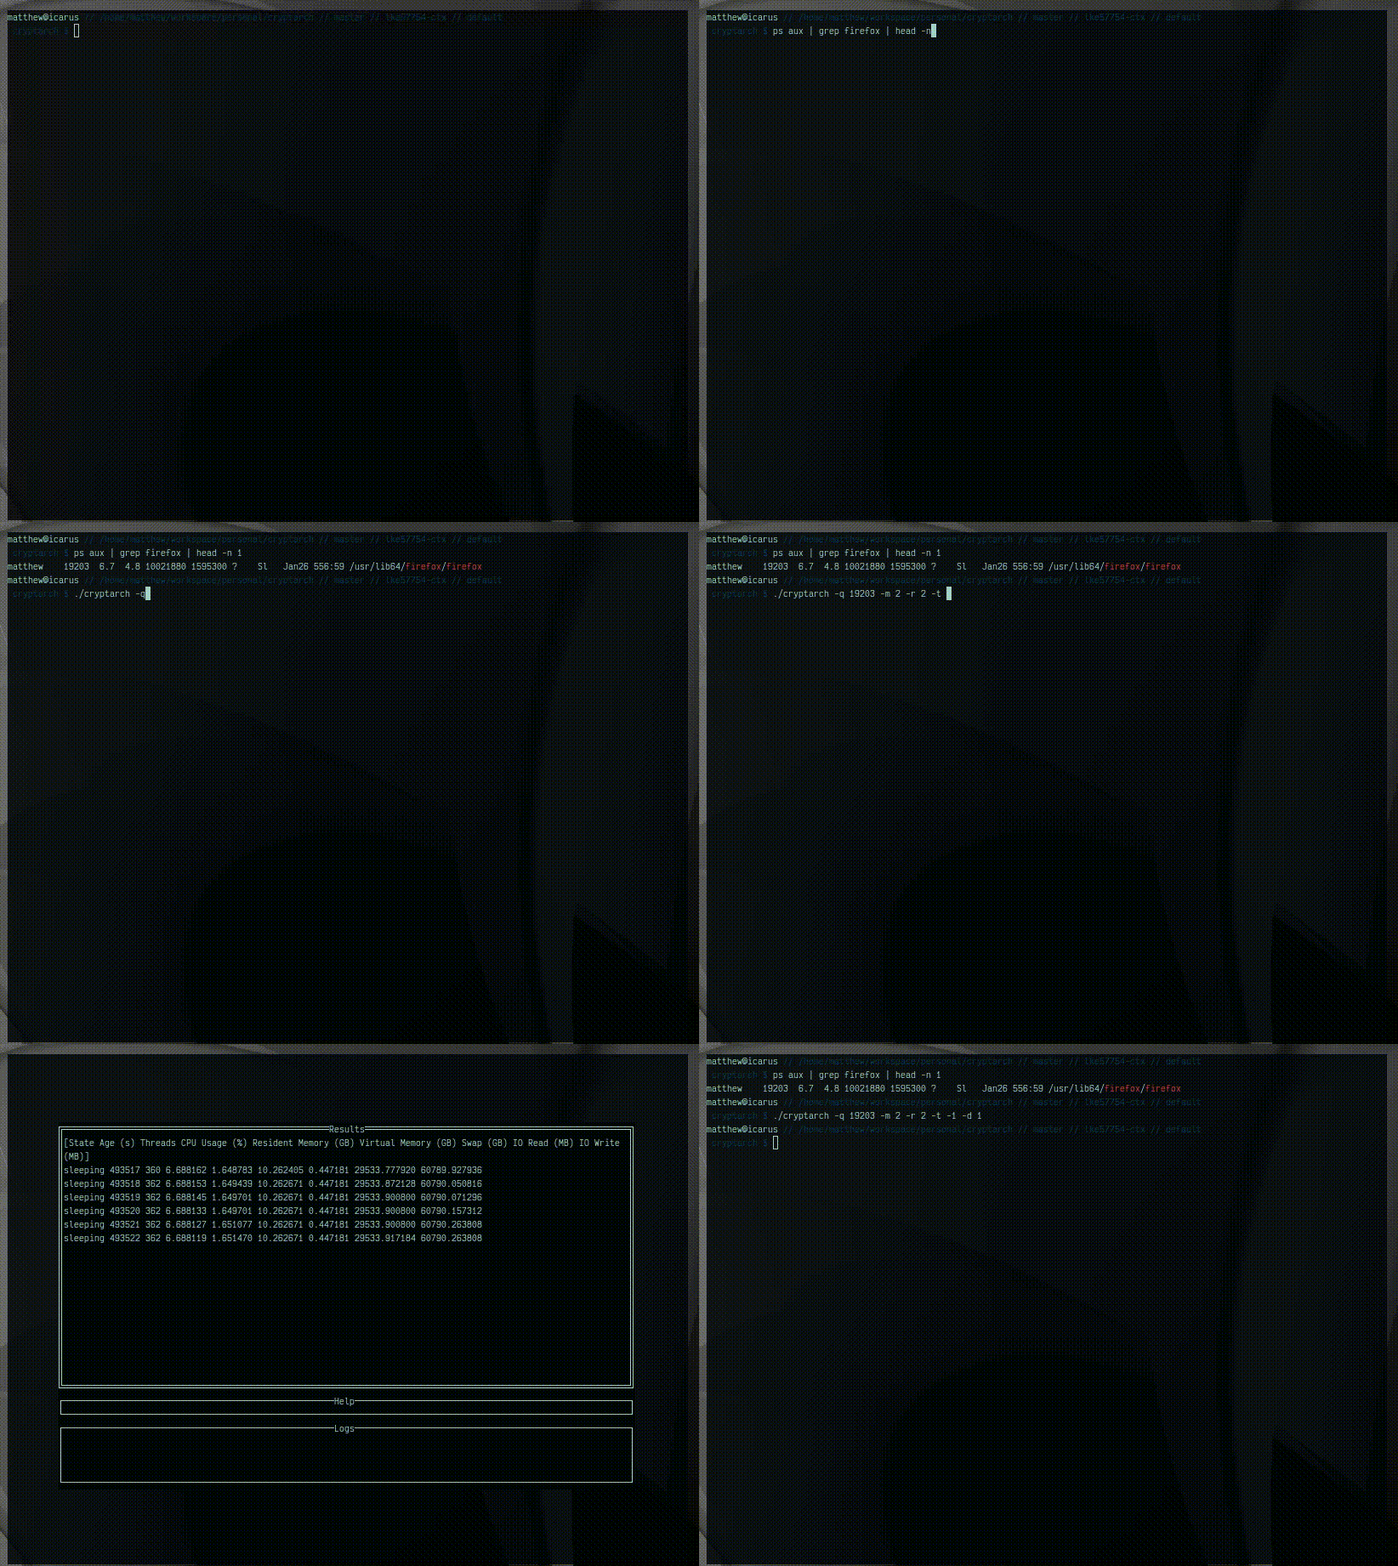
Profile mode is like Query mode except specialized for inspecting systems or processes.

Displays
Cryptarch also has "displays" that determine how data is presented.
Raw display and stream display simply presents incoming data, the latter being within
Cryptarch's interactive window. The examples above use stream displays.
Table display will parse results into a table.

Graph display will target a specific field in a result and graph it (this requires the query to
produce a number).

Examples
These examples show basic usage.
The examples below have been tested on GNU bash, version 5.2.15(1)-release.
# See help.
cryptarch -h

# Execute `whoami` once, printing results to the console and waiting for a user to `^C`.
cryptarch -query 'whoami'

# Execute `uptime` continuously, printing results to the console, without using persistence.
cryptarch \
    -count -1 \
    -query 'uptime' \
    -store=none

# Get the size of an NVME disk's used space and output it to a table with the specific label "NVME
# Used Space".
cryptarch \
    -count -1 \
    -display 3 \
    -labels "NVME Used Space" \
    -query 'df -h | grep nvme0n1p2 | awk '\''{print $3}'\'''
Integrations
Cryptarch can send its data off to external systems, making it useful as an ad-hoc metrics or log
exporter. Supported integrations are listed below.
Prometheus
Both normal Prometheus collection and Pushgateway are supported.
# Start a Prometheus collection HTTP page.
cryptarch --prometheus-exporter <address>

# Specify a Prometheus Pushgateway address to send results to.
cryptarch --prometheus-pushgateway <address>
- Metrics name will have the structure
cryptarch_<query> where <query> will be changed to
conform to Prometheus naming rules.
- Cryptarch labels supplied with the
-labels will be saved as a Prometheus label called
cryptarch_label.
As an example, given a query cat file.txt | wc, and -labels "newline,words,bytes", the following
Prometheus metrics would be created:
cryptarch_cat_file_txt_wc{cryptarch_label="newline"}
cryptarch_cat_file_txt_wc{cryptarch_label="words"}
cryptarch_cat_file_txt_wc{cryptarch_label="bytes"}
NOTE: The only currently supported metric is a Gauge and queries must provide something
numerical to be recorded.
Persistence
Cryptarch, by default, will store results and load them when re-executing the same query.
The only currently supported storage is local disk, located in the user's cache directory. See:
https://pkg.go.dev/os#UserCacheDir.
Expressions
Cryptarch has the ability to execute "expressions" on query results in order to manipulate them
before display (e.g. performing statistics, combining values, producing cumulative series, etc.).
Some key points about expressions:
- Multiple expressions may be provided and execute in the order provided.
- Filters apply before expressions.
- It uses Expr, a Go-centric expression language.
- The expression language is type sensitive, but results of expressions will always be strings.
Expressions are able to access variables:
result, a map of the current result's labels to values.prevResult, the previous result mapping, for cumulative results. Note that expressions must
account for prevResult being an empty map for the first result in a series.
Some examples:
# Multiply the 5m CPU average by 10. Note that we invoke `get` with a key of `"9"` because default
# labels are string indexes and no labels were provided.
cryptarch -query 'uptime | tr -d ","' -expr 'get(result, "9") * 10'

# Cumulatively sum 5m CPU average. Note that we need to account for prevResult being empty and we
# must convert the prevResult from a string to a float.
cryptarch -query 'uptime | tr -d ","' -filters 9 -expr 'get(result, "0") + ("0" in prevResult?
float(get(prevResult, "0")) : 0)'
See: https://expr-lang.org/docs/language-definition
Future
I've been adding planned work into project issues
and project milestones--take a look there to
see what's coming or to make suggestions.
Planned improvements include things like:
- Background execution.
- Persistent results.
- Ability to perform calculations on streams of data, such as aggregates, rates, or quantile math.
- Better text result management, such as diff'ing.
- Export data to external systems, such as Prometheus.
- ... and Elasticsearch.
- More detailed and varied display modes.
- Historical querying.
- Beter management of textual data, including diffs.
Similar Projects
There doesn't seem to be much out there easily visible that matches the same set of functionality,
but there are a few projects I've found that do some things similarly.
- DataDash, a data visualization tool for the terminal.
- Grafterm, visualize metrics dashboards on the terminal.
- Euoporie, a terminal interactive computing environment for
Jupyter.
 Documentation