Basic example for Golang + Open Telemetry with Grafana Cloud
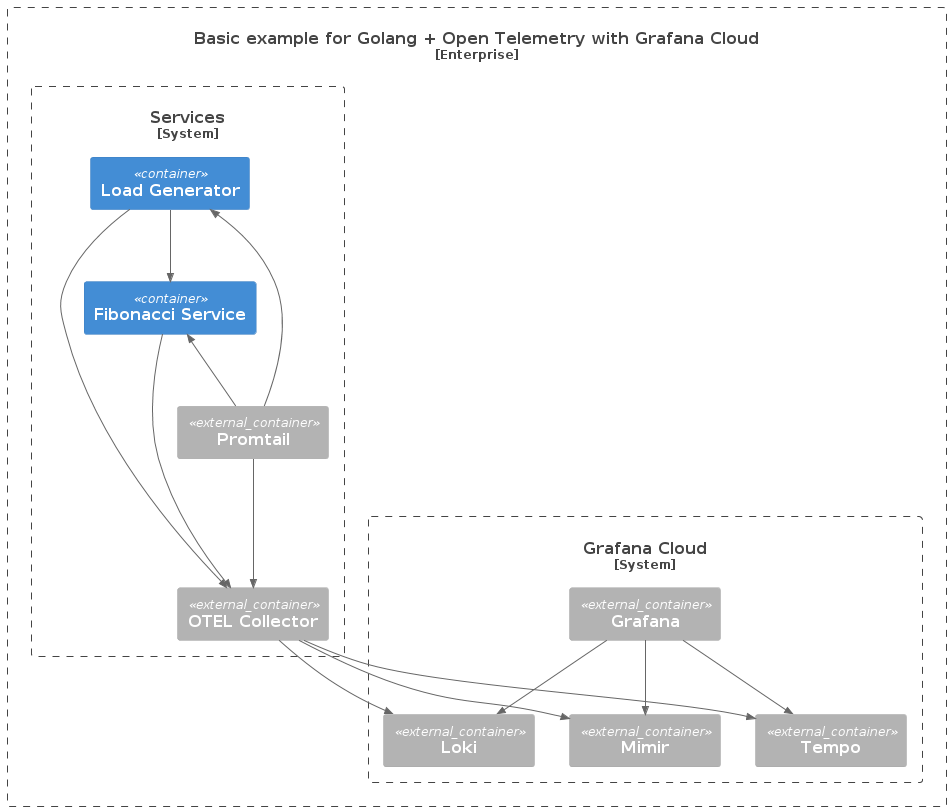
This example have a simple golang service that pushes logs, traces and metrics to Grafana Cloud using Open Telemetry.
It uses docker-compose to build and run all the parts and serves as an easy start to get going with Open Telemetry.
To run
Running this example is as easy as executing docker compose up --build.
However you need to configure with your URLs and Credentials, for more information, see the section for Open Telemetry Collector.
Architecture
- The
Fibonacci Service exposes an http endpoint to calculate Fibonacci values based on the input.
- A
Load Generator that will call the Fibonacci Service continously.
Promtail which picks up logs from the Fibonacci Service and the Load Generator to push them to the Open Telemetry Collector.Open Telemetry Collector which receives logs, traces and metrics and forwards them to Grafana Cloud.Grafana Cloud for storing logs, traces and metrics as well as the Grafana UI.

Grafana Cloud Setup
To sign up for Grafana Cloud, go to https://grafana.com/.
Open Telemetry Collector
To read more about Grafana and how to use the Open Telemetry Collector.
https://grafana.com/docs/opentelemetry/collector/
To configure the OTEL Collector for Grafana, simply replace the URLs and credentials in .config/otel-collector.env with your URLs and credentials.
This guide can help you on how to retreive your URLs and credentials for Grafana Cloud.
https://grafana.com/docs/opentelemetry/collector/send-otlp-to-grafana-cloud-databases/
API_KEY Permissions
Make sure you create API Keys that have permission to write logs, traces and metrics respectively.
Use this link to navigate to My Account in Grafana.
https://grafana.com/auth/sign-in/?cta=myaccount
Then click on Access Policies to setup policies and API Keys.
Requirements