 README
README
LOT (Linux observability Tool : Lots of Tools)
Motivation
LoT is planned to be a command line utility that provides across the board logging and debugging options for processes and containers so that those can be assessed using a single entry and access point.
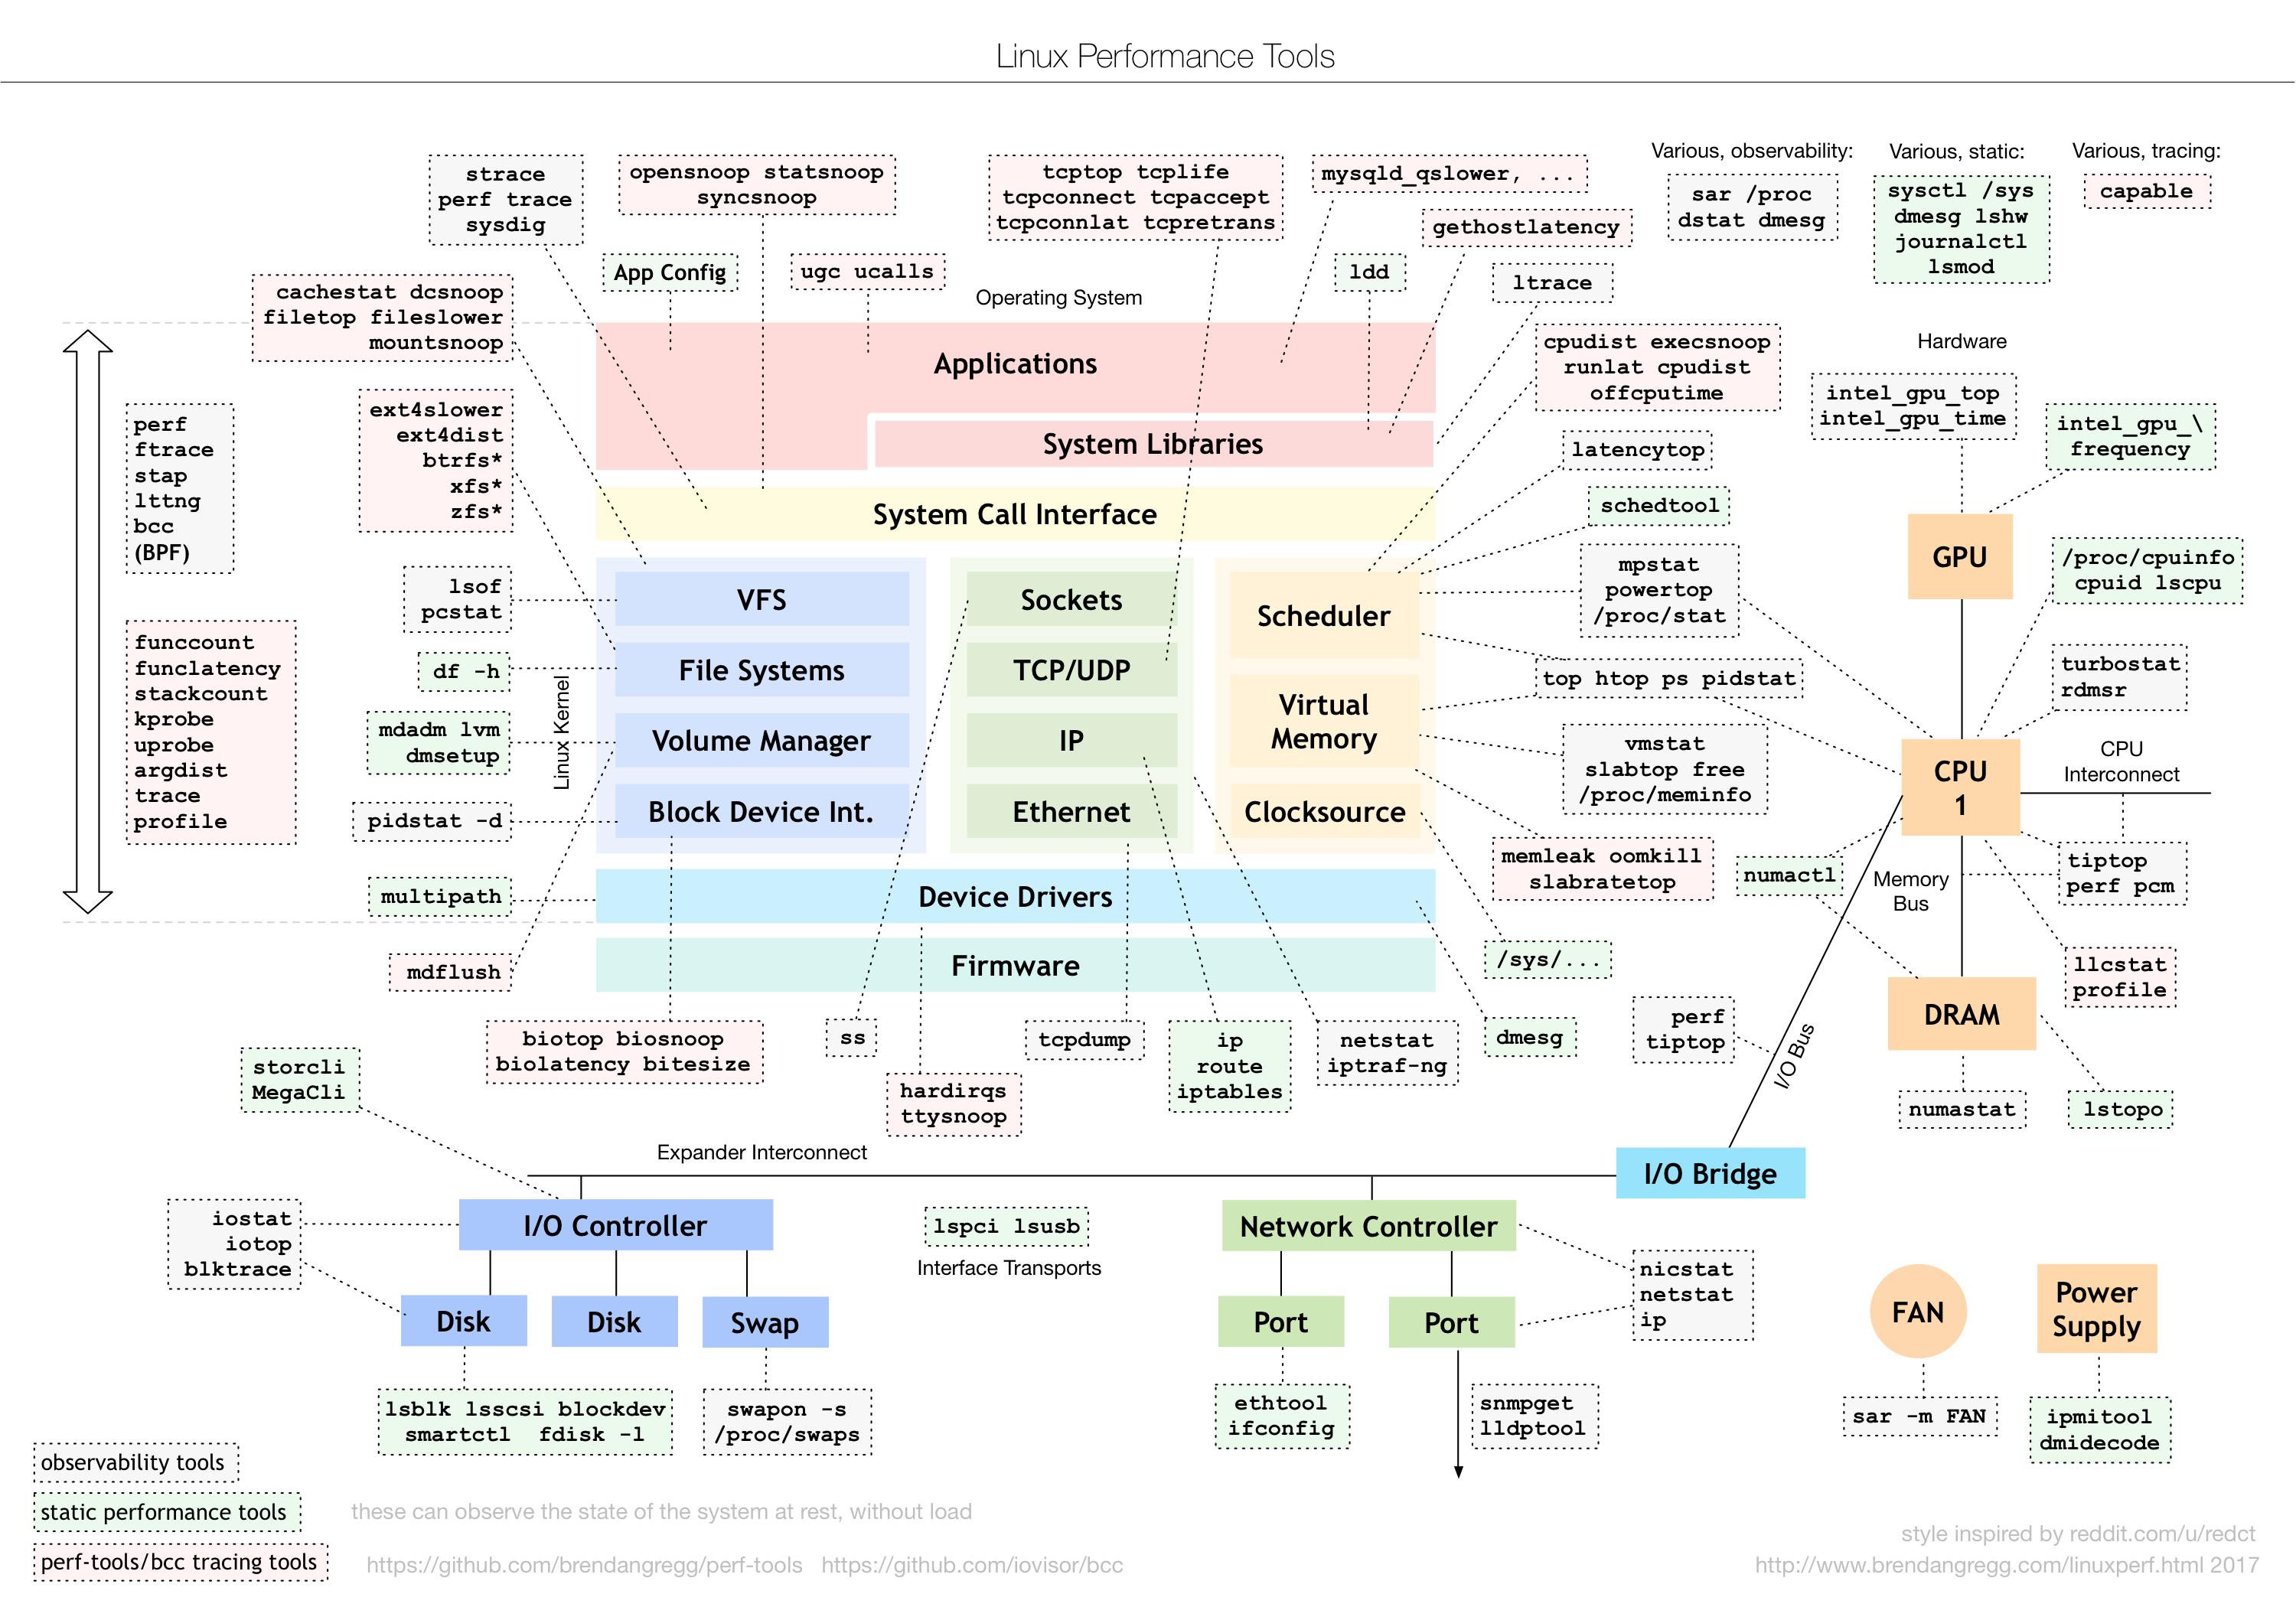
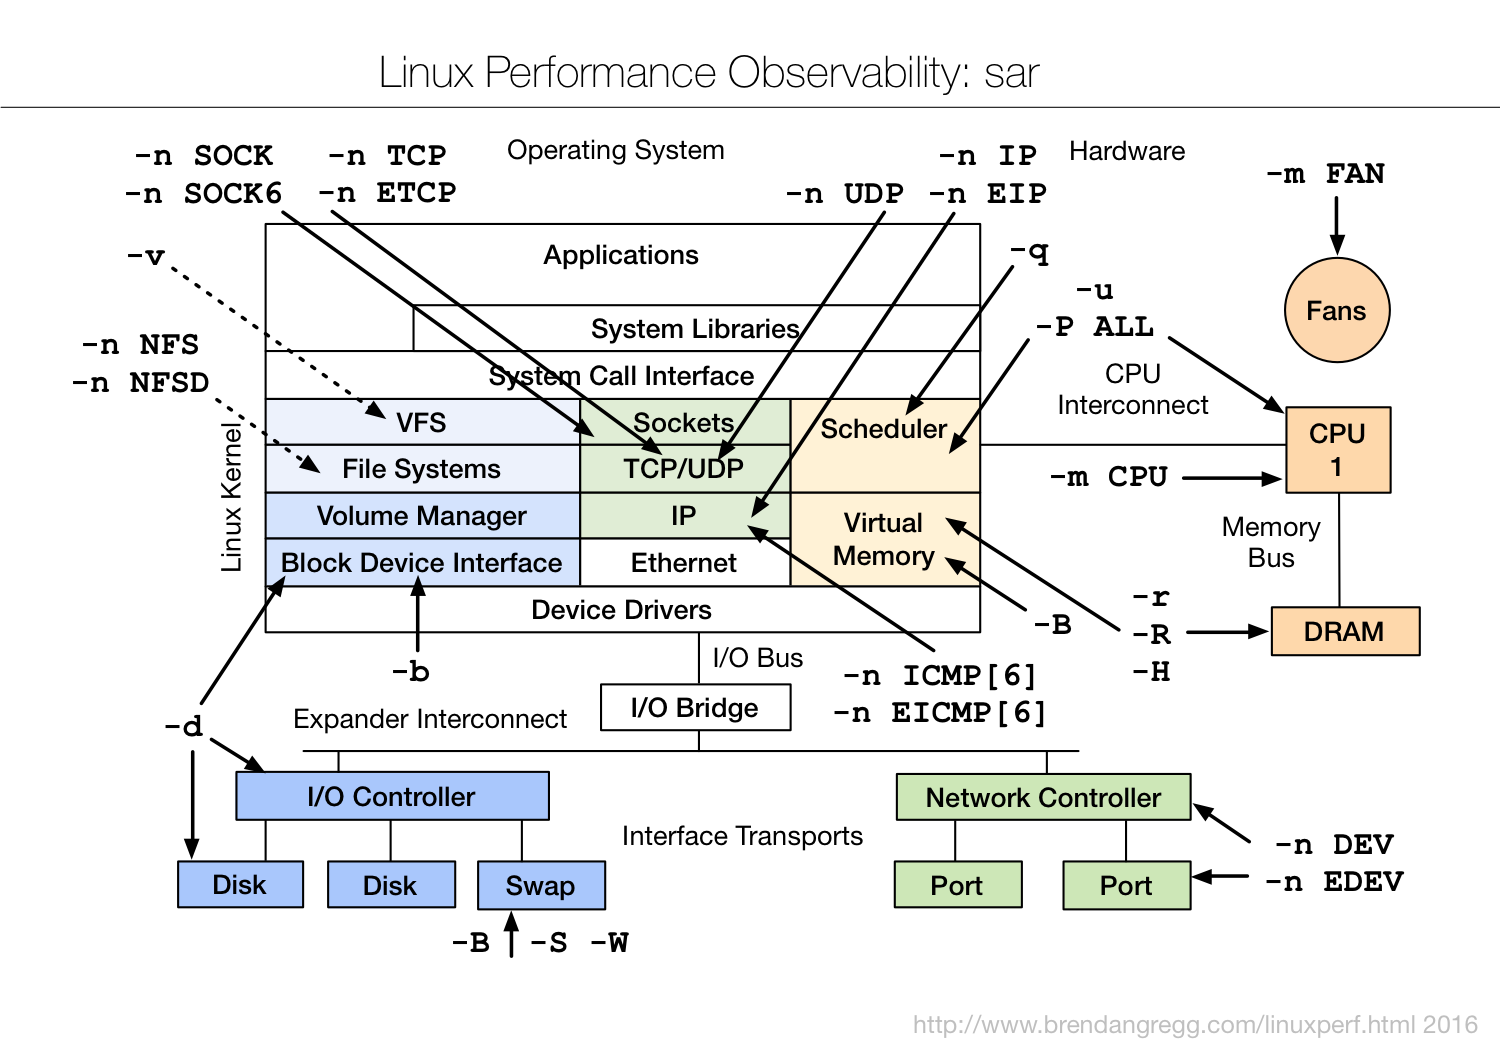
The idea in LoT (linux observability tools/lots of tools) is to aggregate existing functionalities to provide a single point of access to human debuggers. This should also be integratable in pipelines to provide relevant and (if specified actionable) information. In its whole the underlying tools and the work around them are inspired from awesome summarized Linux tools charts from Brendan Gregg.
Getting LoT for your system
LoT is currently unreleased and needs to be built from the source to be used.
Building LoT
Follow the steps below to build LoT on your machine.
Clone the repository.
git clone https://github.com/infracloudio/lot.git
Change directory to lot and run make release-test
cd lot; make release-test
Move the newly created binary to path
sudo cp ./dist/lot_linux_amd64/lot /usr/local/bin/
LoT is now ready to be used.
Usage
Process
Running the command below should bring up the dashboard for processes.
$ lot process
To list the processes, process list command can be run as follows.
$ lot process list
To fetch the information about top processes, the top command can be run as,
$ lot process top
Network
Running the trace command returns hop by hop path to the destination address. The example is as follows,
$ lot network trace 8.8.8.8
To get the information about the Public IP and the private IP addresses of the current machine along with the interface details, simply run network ip as follows.
$ lot network ip
References
New tools developed for the uppcoming book
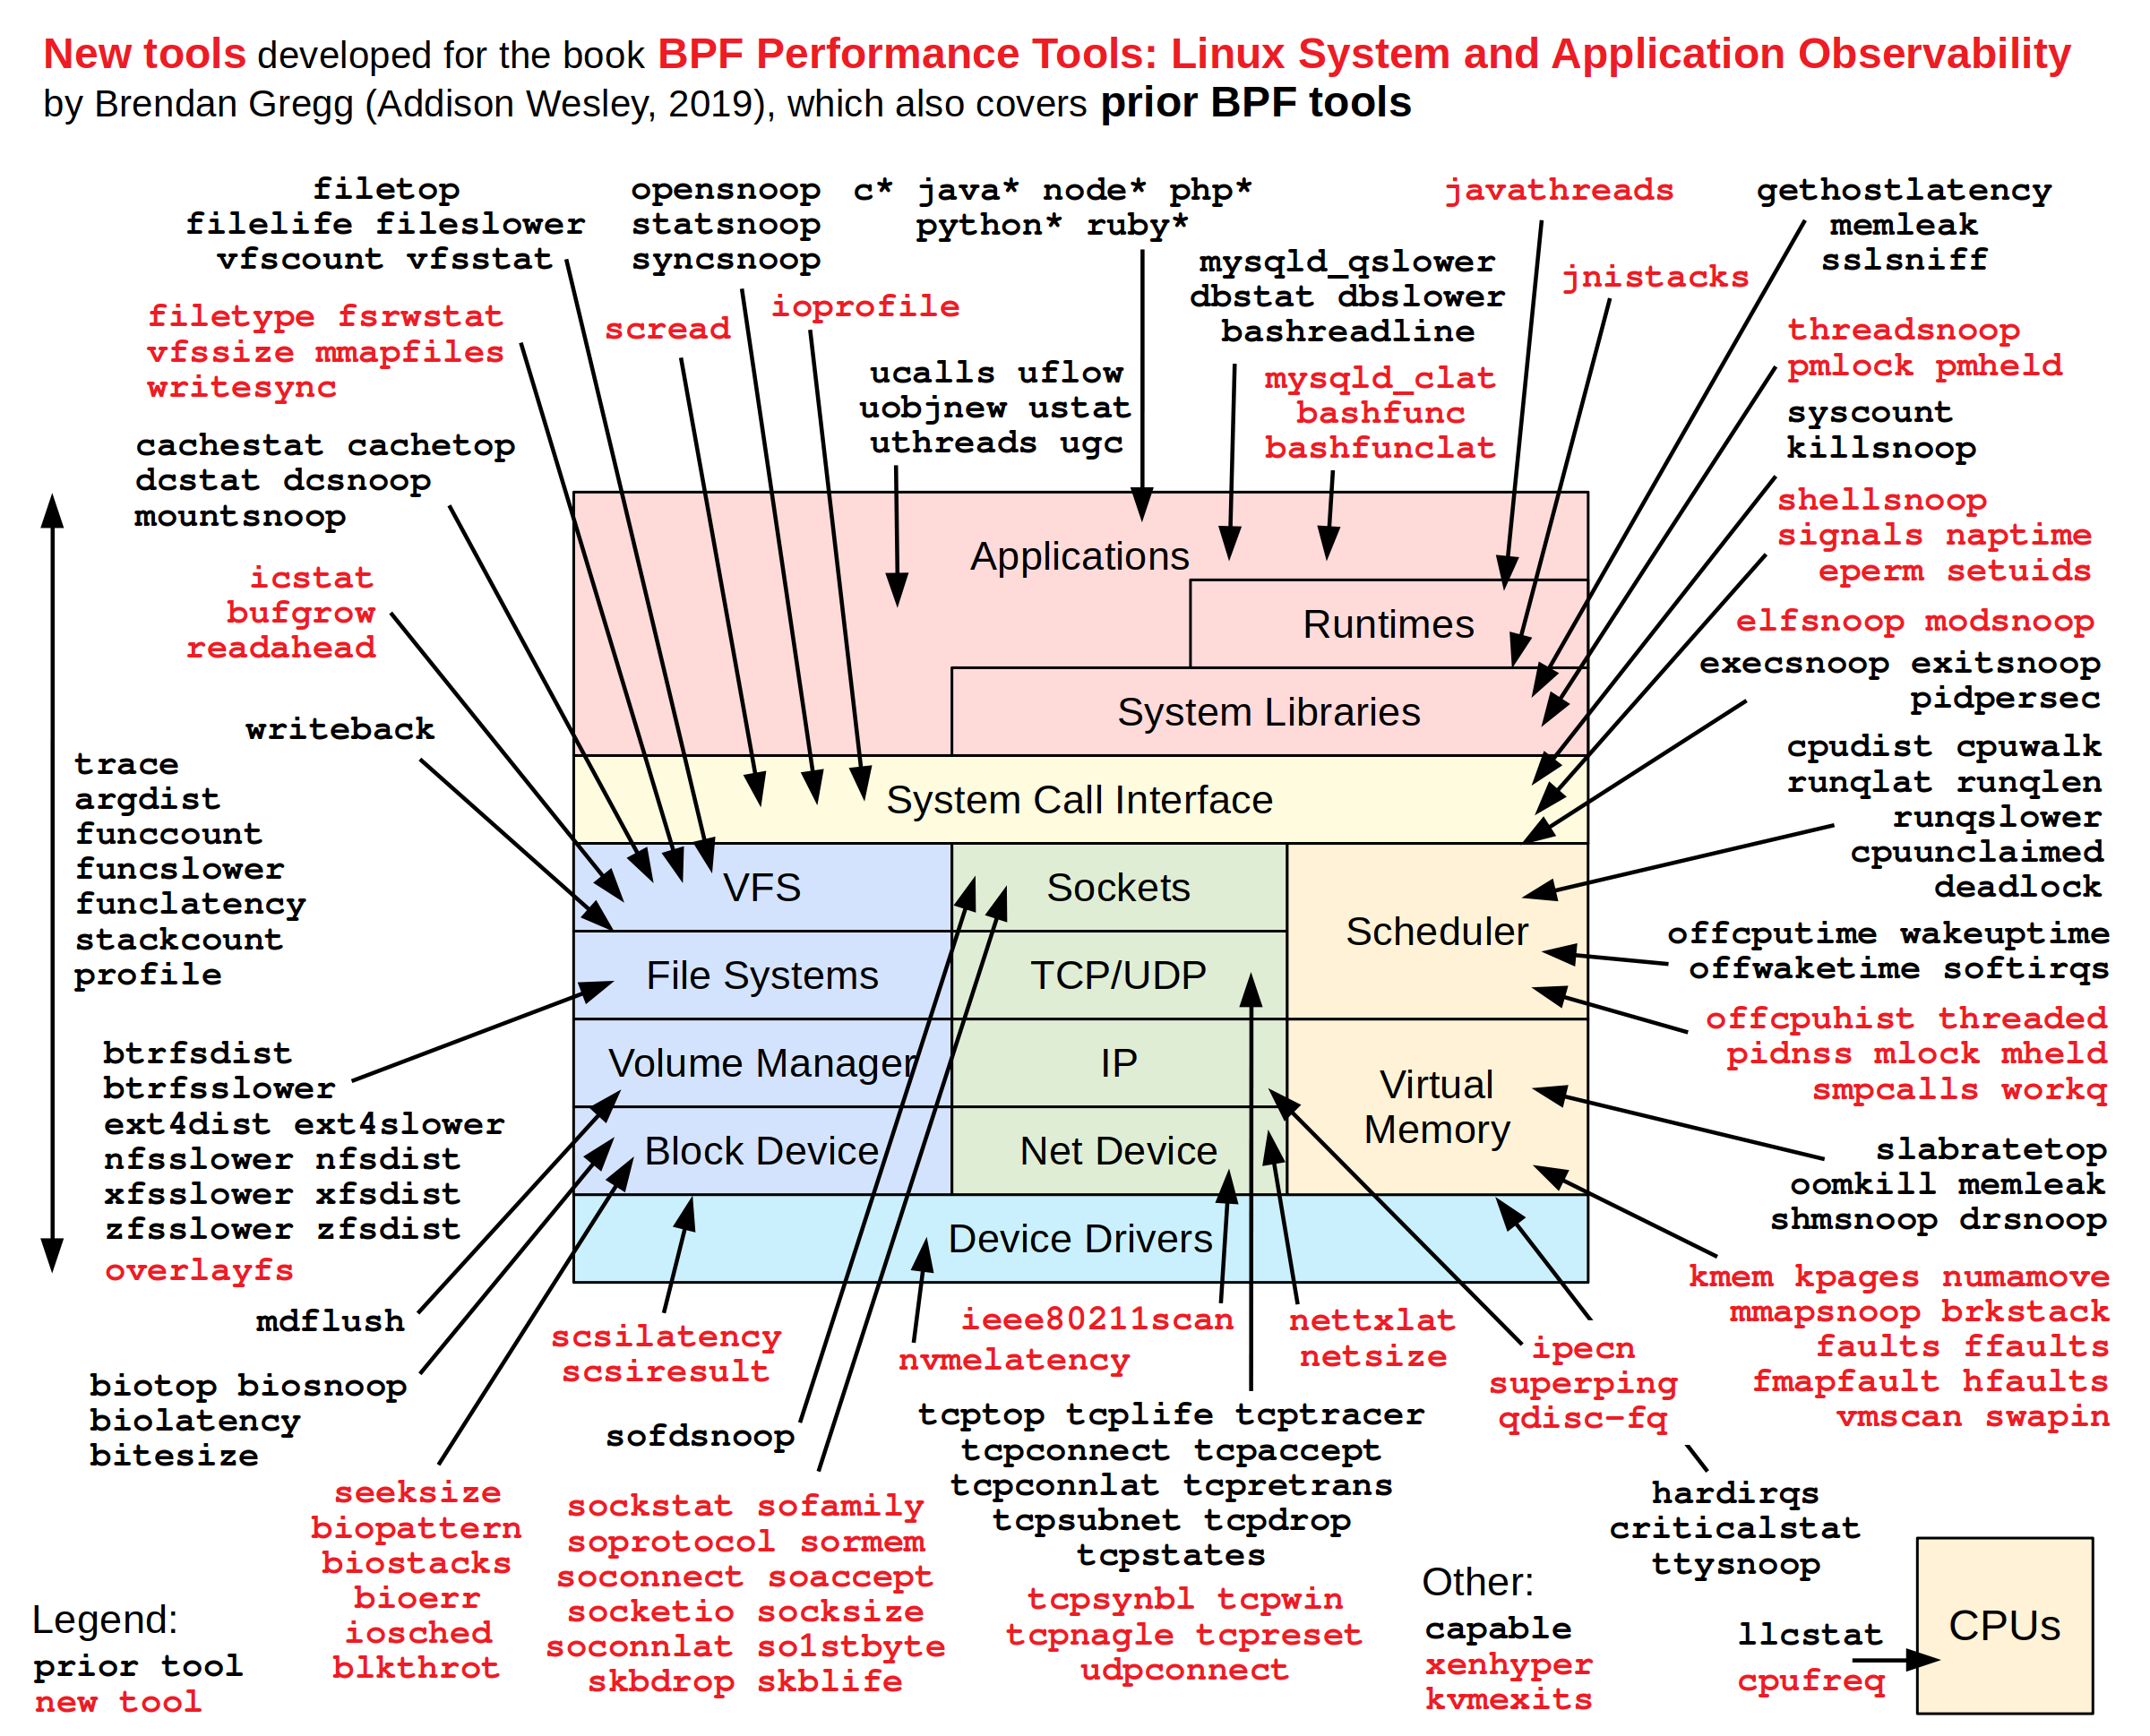
A better breakdown and categorization of the tools are as following:
Linux Static Performance tools
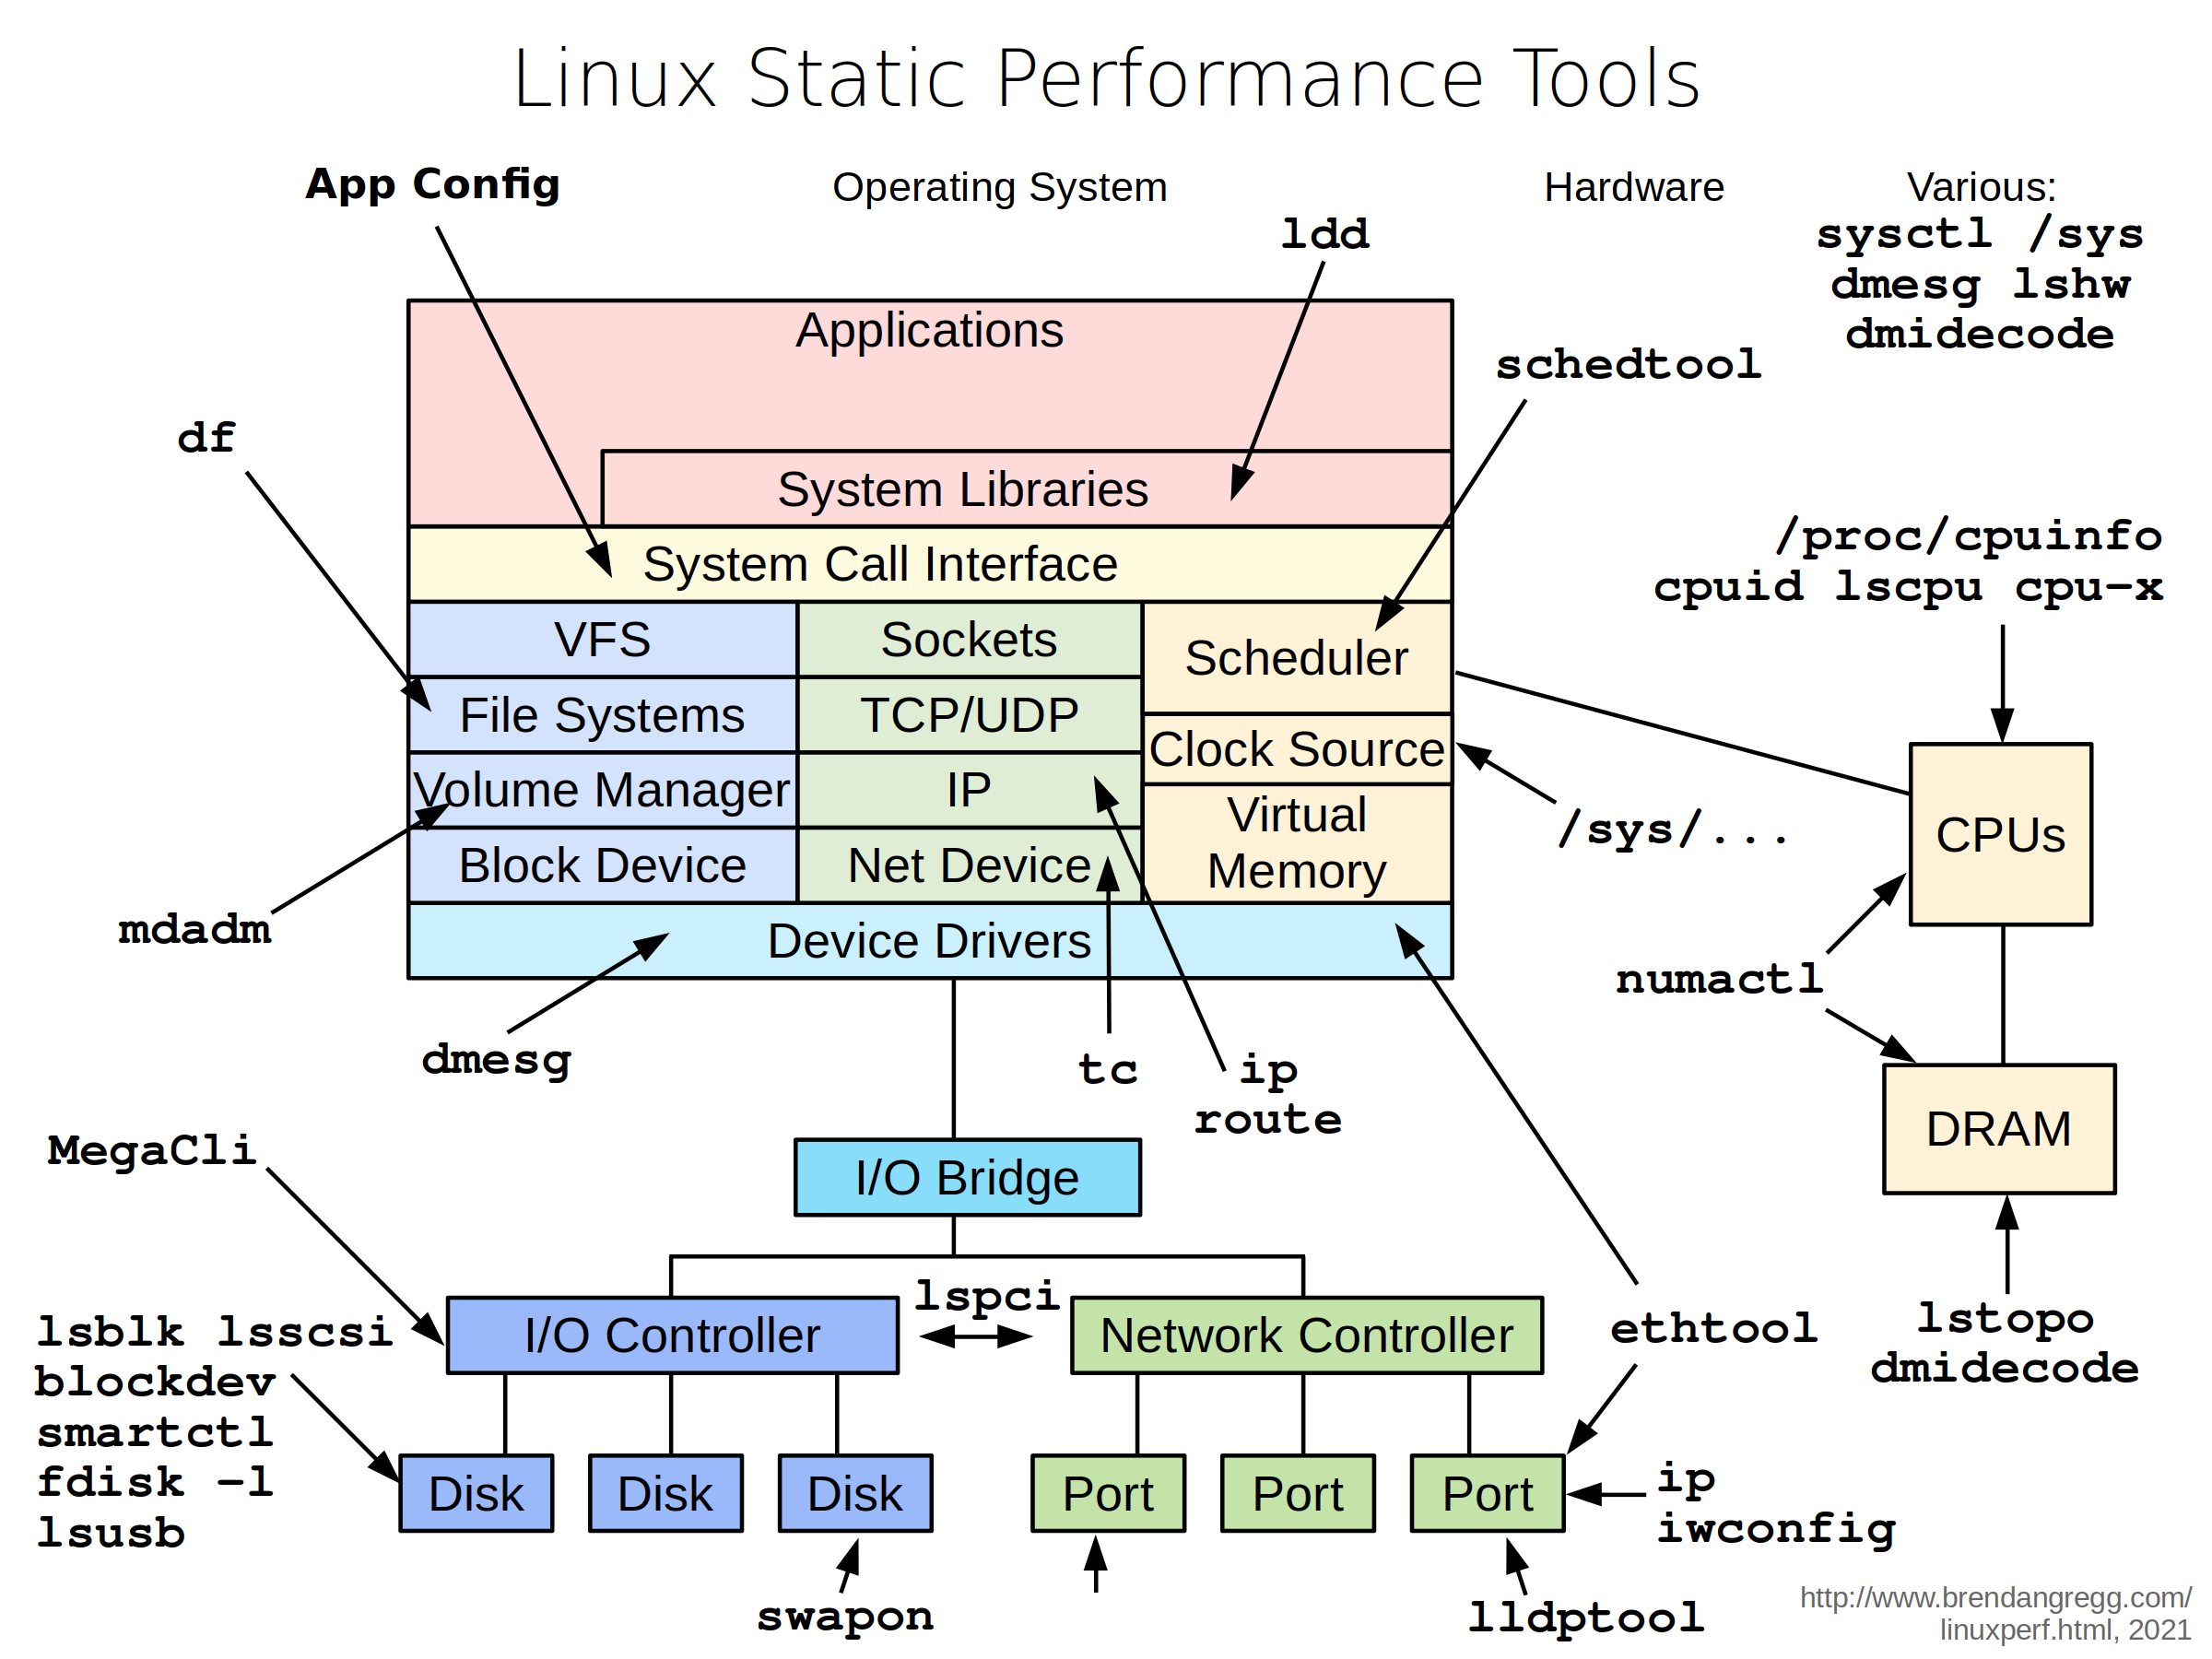
Linux Performance benchamarking tools
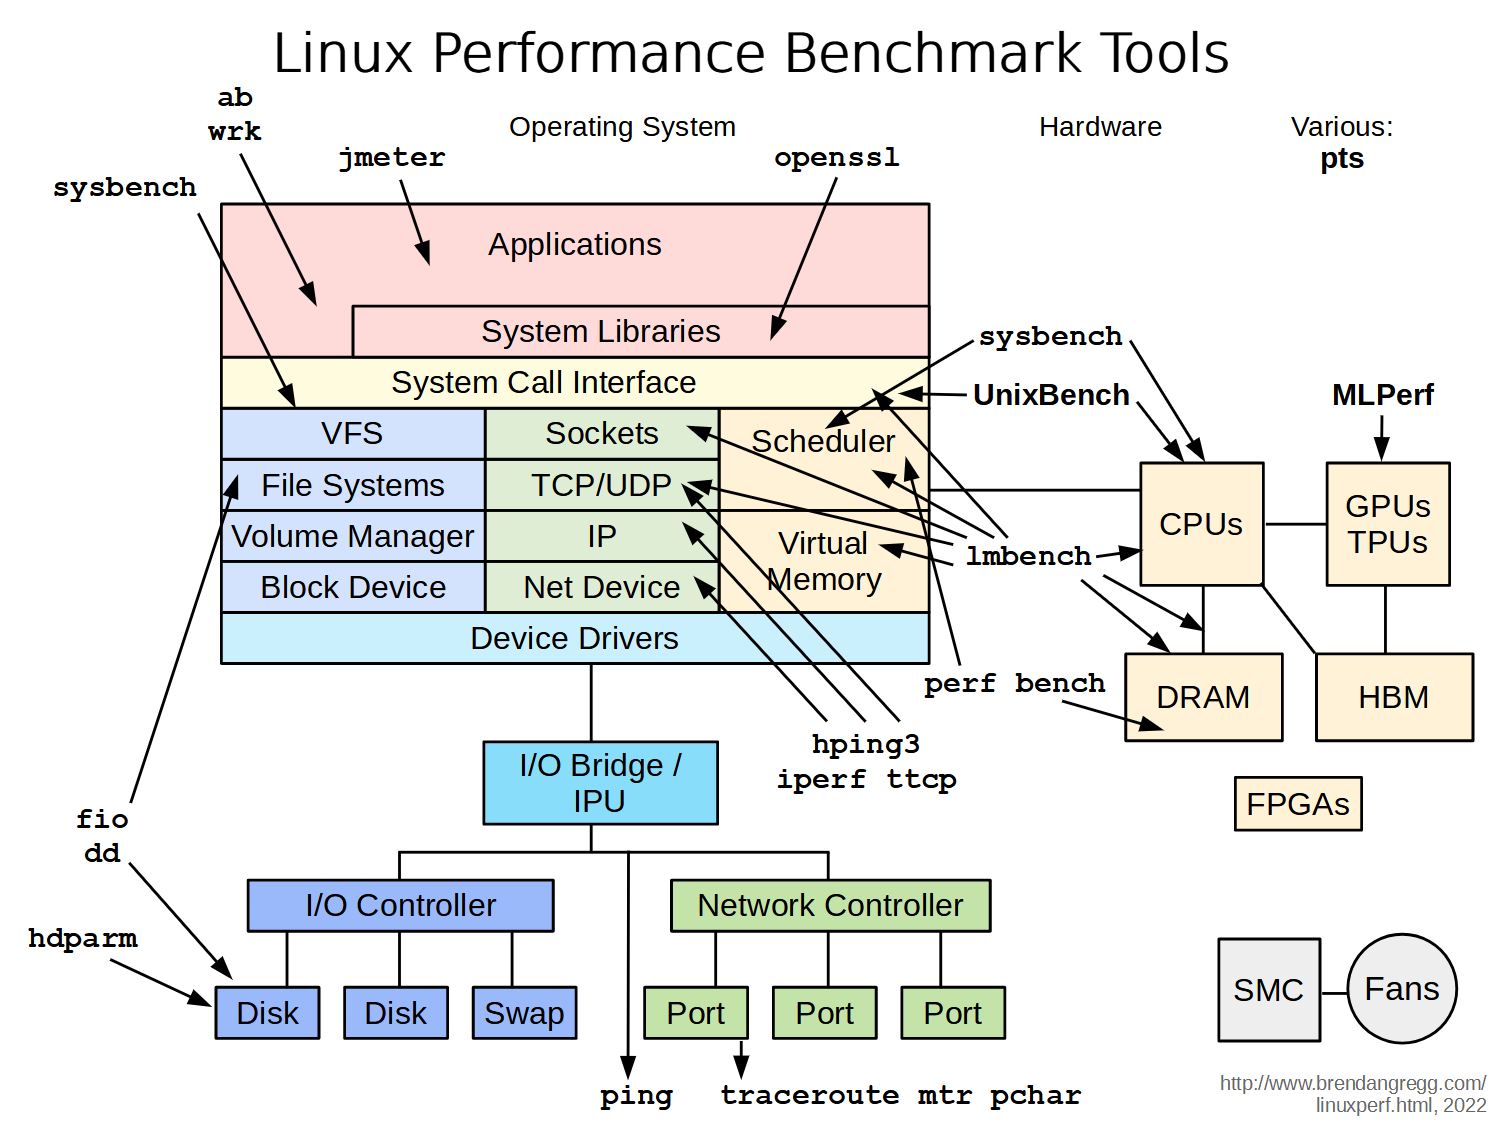
Linux Performance Observability tools
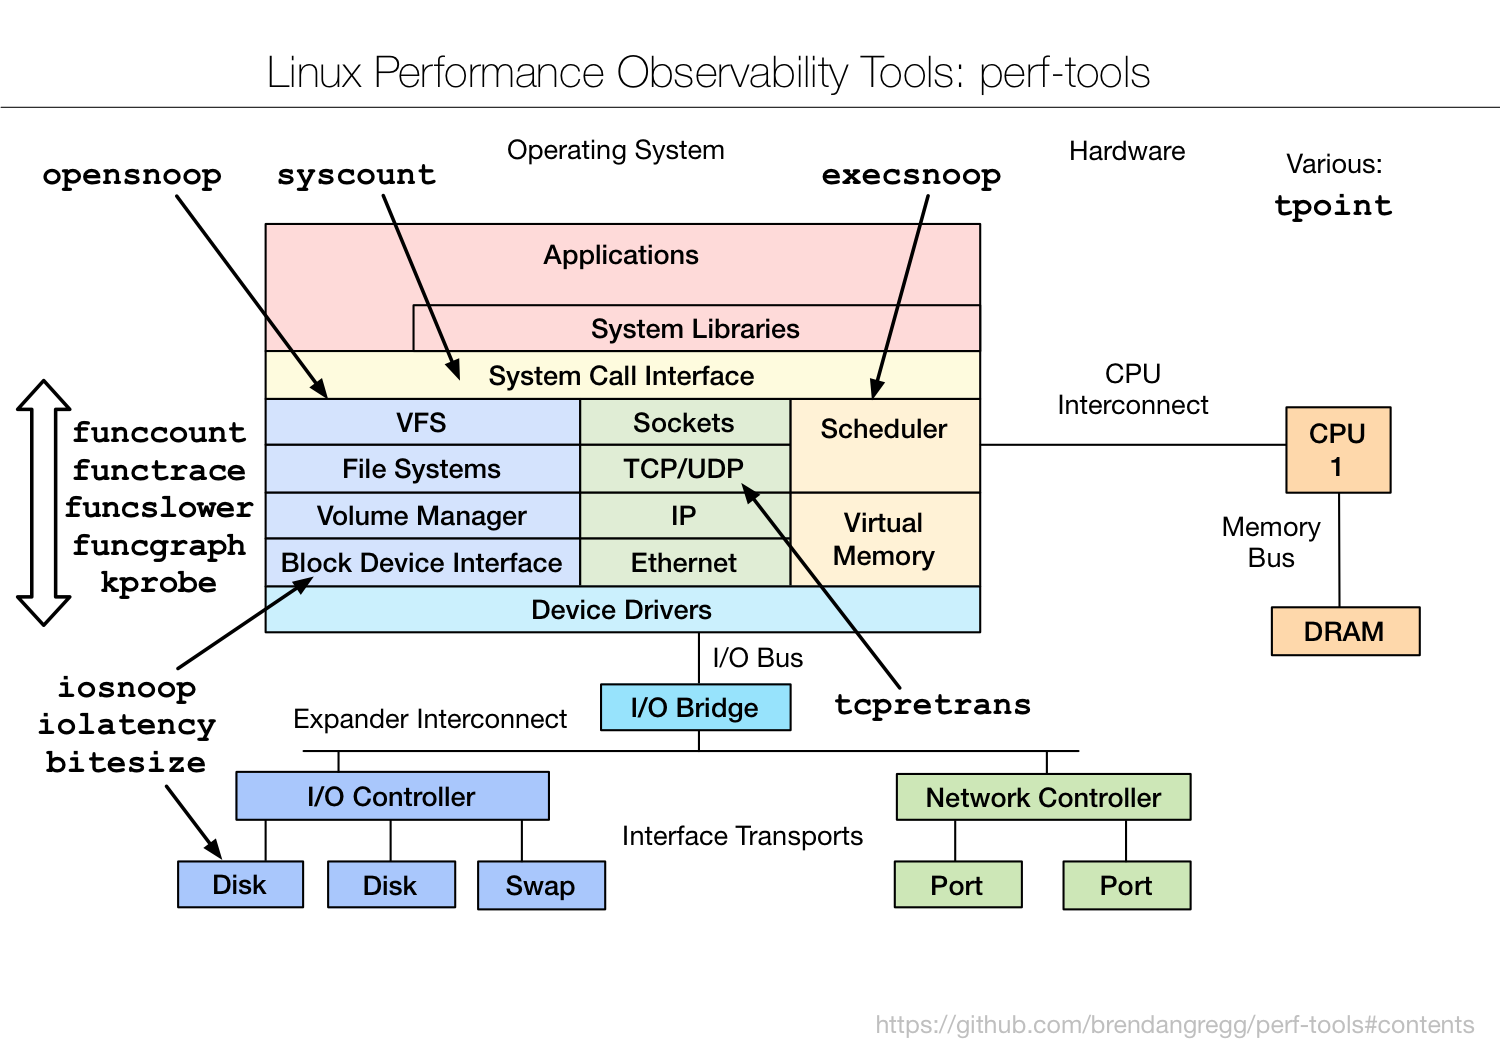
Maybe in future for tuning support we can consider these also.
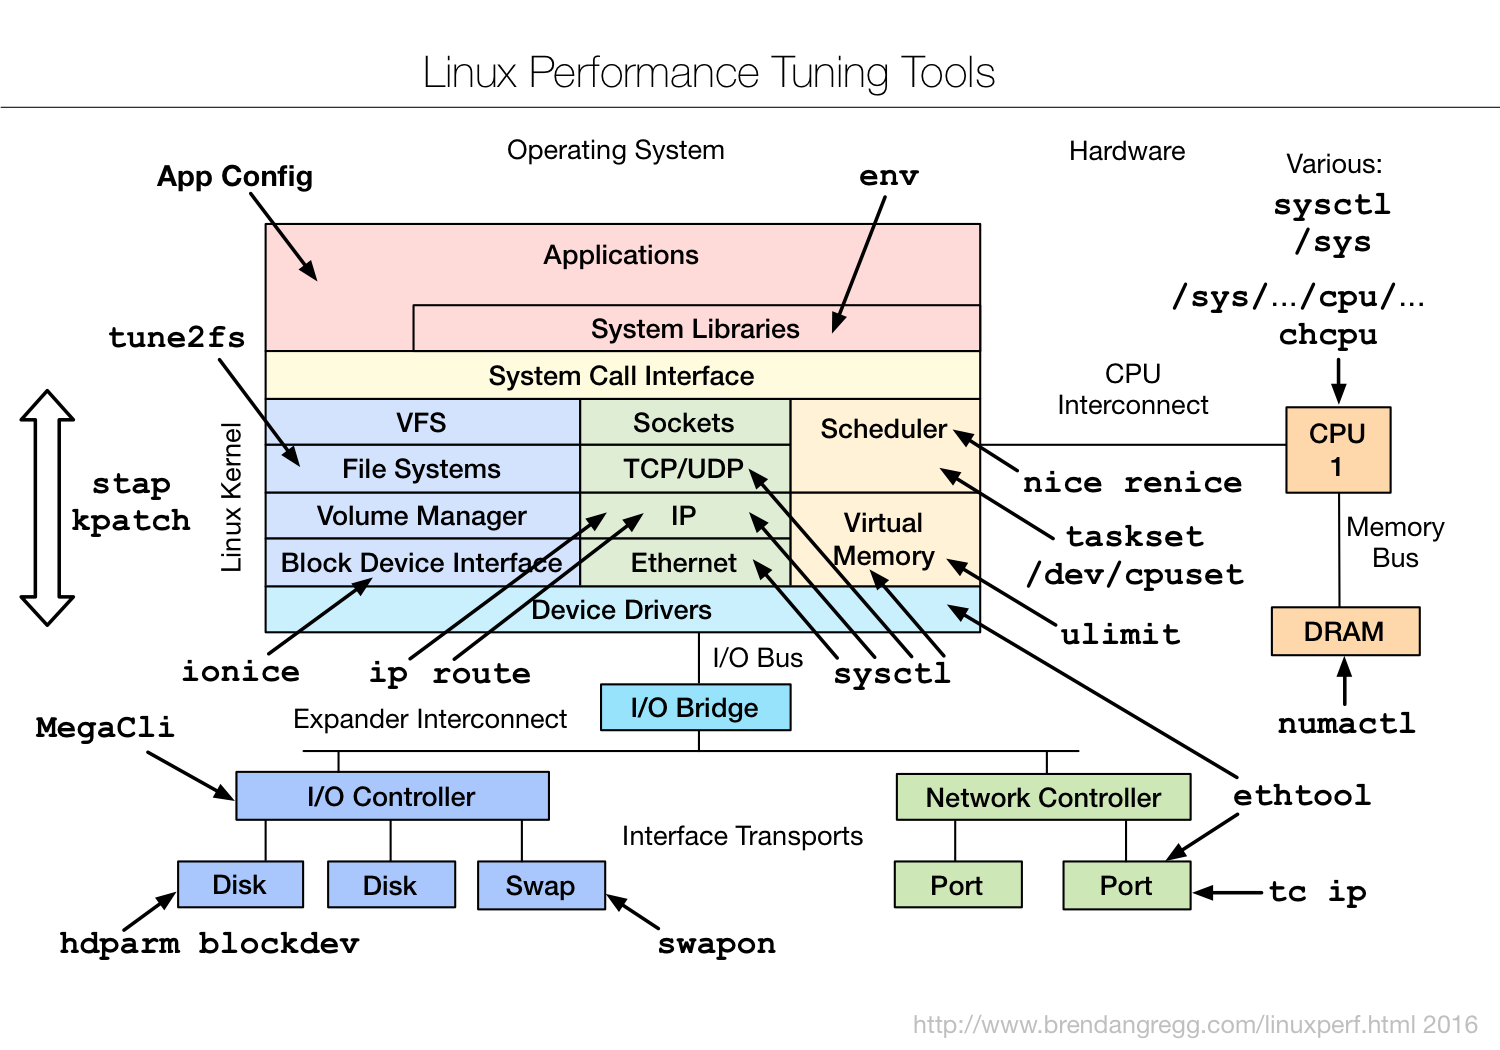
 Documentation
Documentation

There is no documentation for this package.