
Unofficial Prometheus Exporter for Rancher
Note : This project is not officially supported by Rancher/Suse.
Quickstart
-
Enable monitoring in the Rancher Management Cluster, aka local cluster
-
Apply the manifest from this repo : kubectl apply -f ./manifests/exporter.yaml
-
You can set timers by environment variable:
TIMER_TICKER=10 - how ofter read data, in seconds
TIMER_GET_LATEST_RANCHER_VERSION=1 - how often get latest rancher version from github, in minutes
Grafana Dashboards
./manifests/grafana-dashboard includes a basic dashboard in JSON format that can be imported into Grafana.
./manifests/grafana-dashboard-projects.json includes a Rancher project-focused dashboard in JSON format that can be imported into Grafana.
./manifests/grafana-dashboard-all-cr.json includes a dynamic dashboard showing counts for all Rancher custom resources (*.cattle.io).
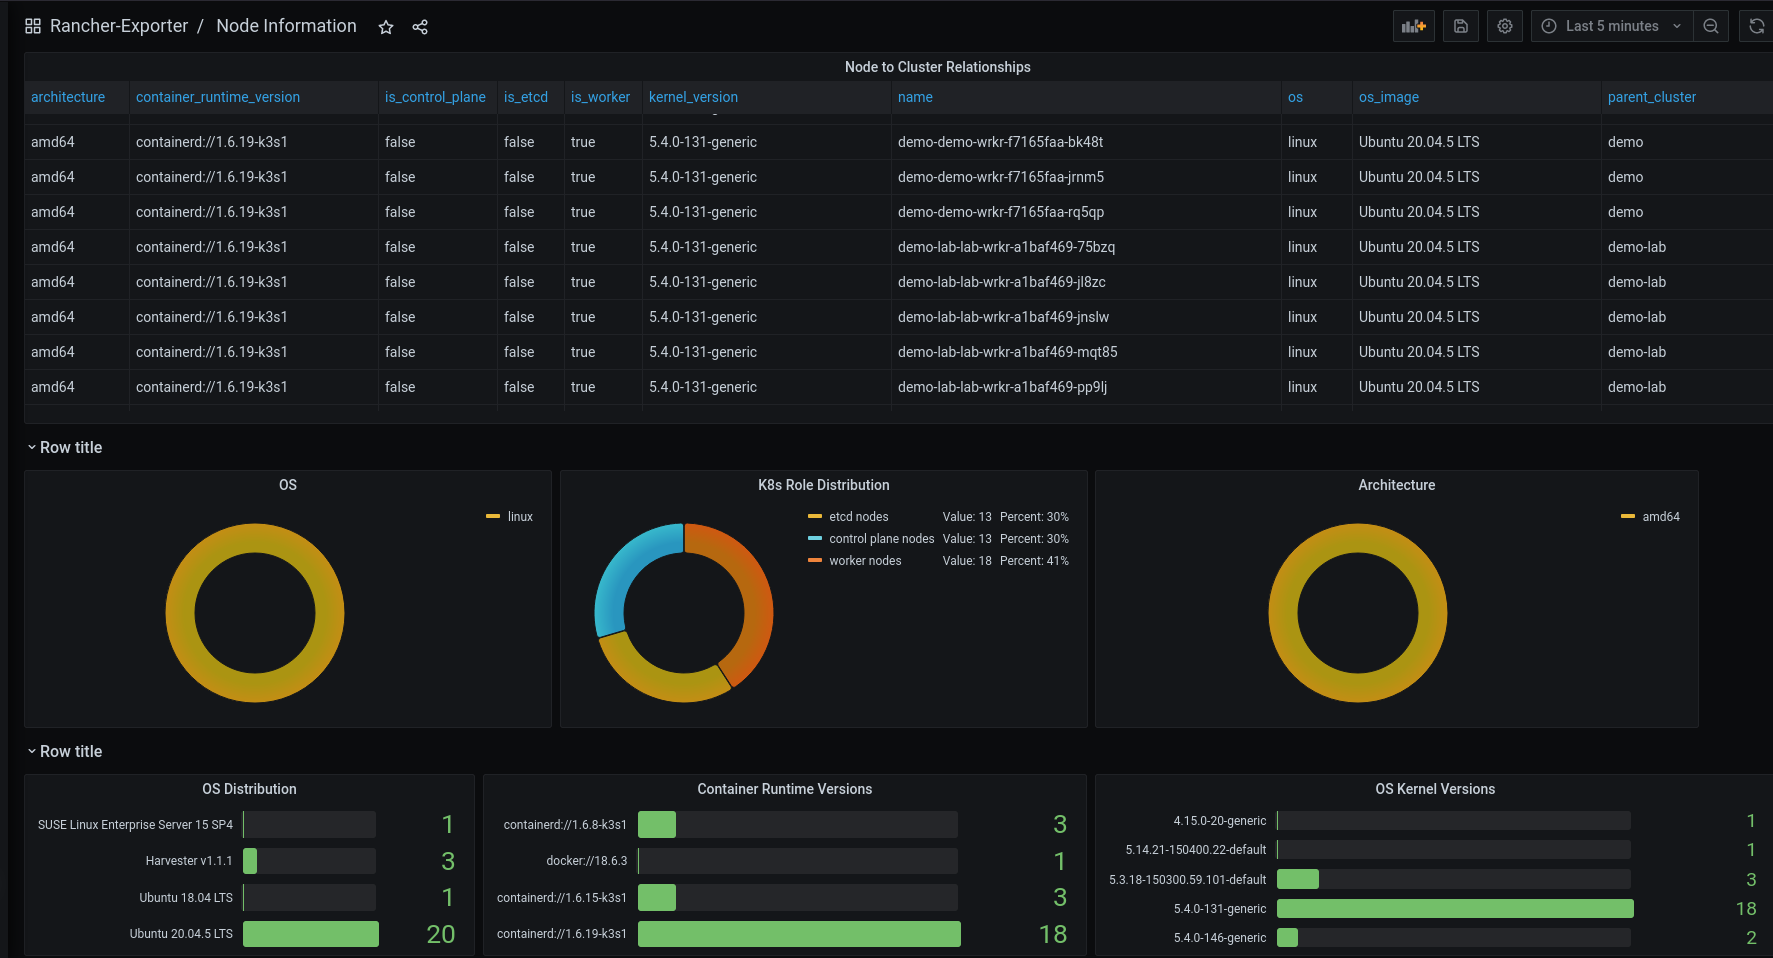
./manifests/grafana-dashboard-nodes.json includes a dynamic dashboard showing global node metadata across all managed clusters (ie Kernel/OS versions, roles, etc)
./manifests/grafana-dashboard-backups-json includes a dynamic dashboard showing details about Rancher backup operator jobs.
Example Screenshots


Developing
By default, the exporter will use in-cluster authentication via a associated service account
External cluster config
To test using external authentication via the local kubeconfig, set the following environment variable:
export RANCHER_EXPORTER_EXTERNAL_AUTH=TRUE